Accessibility Assistant

Make Widget Bigger

Text to Speech

  • Simply select any text on the page to have your computer read it to you.

  • Choose the preferred Text to Speech accent from your available system voices.

Text Controls

Visibility Options

Highlight Links (H)

Translate this page

Color contrast Checker

logo-1
6.1. Current use of big data in the SDGs6.1 6.2. Potential use of big data in other environment-related SDG indicators 6.2 6.3. Potential use of big data for disaggregated environment-related SDG indicators 6.3 6.4. Challenges and possibilities 6.4 6.5 Conclusion6.5

6. Data opportunities

Photo by Joshua Sortino on Unsplash

Authors

Changyong Dou, International Research Center of Big Data for SDGs; Futao Wang, Aerospace Information Research Institute, CAS; Jie Liu, International Research Center of Big Data for SDGs; Lijun Zuo, Aerospace Information Research Institute, CAS; Meng Wang, International Centre on Space Technologies for Natural and Cultural Heritage under the Auspices of UNESCO; Prof. Huadong Guo, International Research Center of Big Data for SDGs; Shanlong Lu, International Research Center of Big Data for SDGs; Xiaosong Li, International Research Center of Big Data for SDGs; Yaxi Chen, Aerospace Information Research Institute, CAS; Yu Chen, International Research Center of Big Data for SDGs

Reviewers

Dilek Fraisl, International Institute for Applied Systems Analysis; Joseph E. Flotemersch, U.S. Environmental Protection Agency; Sarantuyaa Zandaryaa, UNESCO; Susan Mutebi-Richards, UNEP; Xiaosong Li, International Research Center of Big Data for Sustainable Development Goals

6.1 Current use of big data in the SDGs


img

The fulfilment of the SDGs is hindered by the lack of data for effective monitoring and implementation. The official framework of indicators for monitoring the SDGs has undergone several revisions since its adoption in 2015 (UNGA 2017b), and has adopted a tier system to assist in evaluating data availability at the global level. As at 4 February 2022, 136 indicators were categorized as Tier I, 91 indicators as Tier II and four indicators as multiple tiers (IAEG-SDGs 2022). This indicates that, seven years after adoption, a significant number of indicators lack data for more than half of the countries. The gaps are even greater for environment-related SDGs, where insufficient data to report progress were around 58 per cent of indicators at the global level (UNEP 2021b).

Data collected from traditional sources by national statistical offices (NSOs), government ministries and international organizations currently provide the main input to the SDG indicator framework (UNSDSN 2015). Although valuable and necessary, these traditional sources of data fall short due to high costs, poor timeliness and coarse spatial granularity. In recent years, big data sources are increasingly being recognized as new and innovative information sources for SDGs (MacFeely 2019; IAEGSDGS 2019; Tam and Van Halderen 2020). Many NSOs are already experimenting with big data in the production of official statistics, with initiatives catalogued by the United Nations Global Working Group on Big Data and the United Nations Global Pulse. Currently, the dominant big data types include Earth Observation (EO) data, citizen science, other sensor network data, commercial data, tracking data, administrative data, and opinion and behavioural data. Combined with advanced analytical techniques (e.g. machine learning, geospatial modelling and geostatistical modelling), they could contribute to the monitoring of 15 goals, 51 targets and 69 indicators (Allen et al. 2021), particularly those related to health and biodiversity.

6.2 Potential use of big data in other environment-related SDG indicators

In general, big data would play a key role in the monitoring and reporting of SDGs through addressing the remaining gaps (e.g. in terms of providing new data sets for Tier II indicators), allowing for more timely and disaggregated data sets to fill gaps in time series and spatial coverage for Tier I indicators and contributing disaggregated information to official indicators. For instance, big data has shown great potential in water-related and other environment-related SDG indicators, among which EO data and citizen science were most widely exploited (UNESCAP 2021b). Big data may be used in conjunction with or as a replacement for traditional data sources to improve, enhance and complement existing statistics.

6.2.1 Satellite and other EO data

Satellite and other EO data hold huge potential for monitoring indicators describing the environmental aspects of the planet and to support the aim of the 2030 Agenda to leave no one behind as, by nature, space-borne observations are borderless, impartial and inclusive of all. In 2018, the Committee on Earth Observation Satellites (CEOS) with the support of the European Space Agency (ESA) pointed out that 73 targets and 29 indicators in total could be supported by EO data sets and that UNEP was one of the custodians whose indicators could benefit the most from EO (CEOS 2018). SDG 2 on zero hunger, SDG 6 on clean water and sanitation, SDG 11 on sustainable cities and communities, SDG 13 on climate action, SDG 14 on life below water and SDG 15 on life on land are mostly appropriate for EO since their targets and indicators require information on land cover, land productivity, above-ground biomass, water extent, greenhouse gas emissions or air pollution.

Many agencies and initiatives are spearheading efforts to support the monitoring of the SDGs with EO: (a) The EO4SDG initiative was launched in 2016 by the Group on Earth Observations (GEO) (GEO 2022); (b) in 2016, CEOS established the CEOS Ad Hoc Team on SDGs (CEOS n.d.), dedicated to improving coordination between the world’s space agencies in support of satellite data provision for the 2030 Agenda; (c) the development of a series of reports by the International Research Center of Big Data for SDGs (CBAS) on how EO could facilitate many goals at the local and global scales (CBAS n.d.a); (d) the Sustainable Development Science Satellite (SDGSAT-1) Open Science Program, launched in 2021 (CBAS n.d.b), consists of a sharing platform for SDGSAT-1 data; (e) UNESCO’s World Water Quality Portal monitors water quality by using satellite EO data (UNESCO 2022).

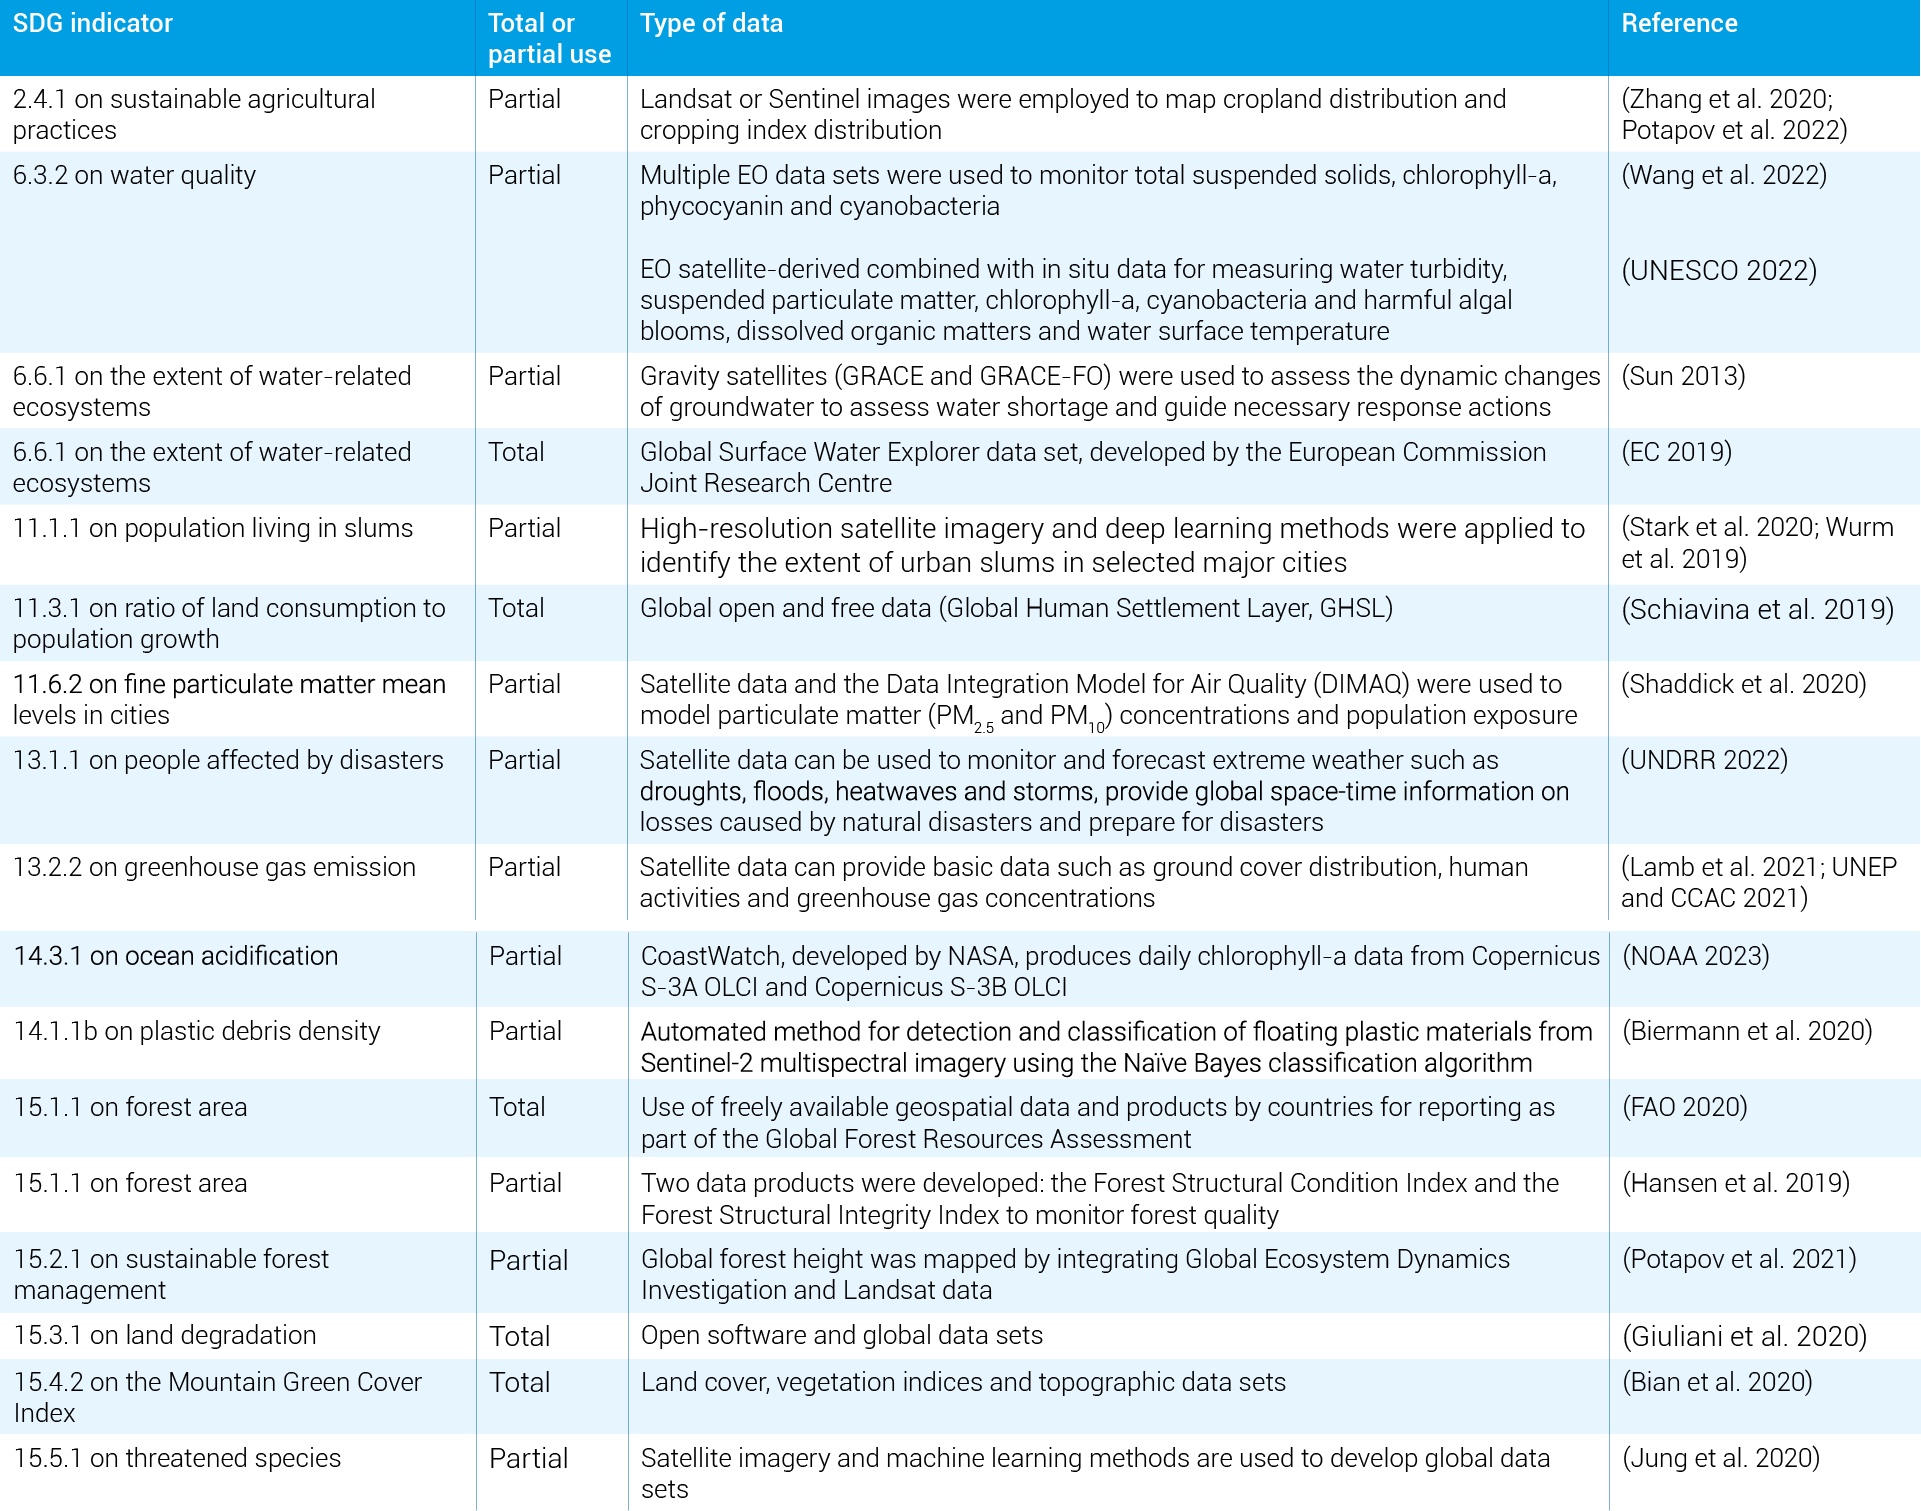
Satellite data combined with advanced analytical methods (e.g. machine learning and geospatial modelling) could provide new global data sets for monitoring official SDG indicators. Currently, several SDG indicators have satellite-based data and are summarized in Table 6.1.

Table 6.1 Satellite data used in total or partial in SDG indicators
img

6.2.2 Citizen science

Citizen science can be broadly defined as public participation in scientific research and knowledge production (Fraisl et al. 2022a). Citizen science activities can take diverse forms, from hypothesisdriven projects led by scientists where volunteers are only involved in data contribution to initiatives designed by scientists and volunteers together where volunteers participate in more or all aspects of the project, for example, identifying the research questions, collecting data, analysing the data and disseminating the results. Sharing observations related to biodiversity, classifying galaxies, collecting plastics and other litter and relevant data from rivers, seas and oceans, and measuring water or air quality are just a few examples from environmental citizen science activities. Citizen science has great potential in SDG monitoring and reporting. A review showed that the reporting of 76 indicators could benefit from citizen science, specifically SDG 15 on life on land, SDG 11 on sustainable cities and communities and SDG 6 on clean water and sanitation (Fraisl et al. 2020).

Citizen science data are already being used to report on several SDG indicators. For instance, the Ghana Statistical Service and the Environmental Protection Agency have recently integrated citizen science beach litter data into their official statistics. Ghana has become the first country to use citizen science data on marine plastic litter in their official monitoring and reporting of SDG indicator 14.1.1b. The initiative has helped bridge local data-collection efforts by citizen scientists with global monitoring processes and policy agendas by leveraging the SDG framework. The results have been used in Ghana’s latest voluntary national review for the SDGs and have reported on the United Nations Global SDG Indicators Database, helping to inform relevant policies in Ghana (Olen 2022; NDPC 2022). Biodiversity and conservation are also areas with a strong citizen science presence. For example, SDG indicator 15.5.1 on the Red List Index uses BirdLife International’s network of scientists and more than 2 million birders and local volunteers to compile data on birds (BirdLife International 2022). Another example is the contribution of citizen science to the establishment of protected areas of important terrestrial, freshwater and mountain sites (SDG indicators 15.1.2 and 15.4.1). More than 13,000 Important Bird and Biodiversity Areas in global KBAs were established by BirdLife International using data from their volunteer network (Donald et al. 2019). FreshWater Watch is a global citizen science project and platform for monitoring freshwater quality, which has empowered tens of thousands of people around the world to become citizen scientists since 2012. These citizen scientists are improving monitoring, management and idea-sharing about freshwater-related ecosystems in their local areas (FreshWater Watch 2022). Air and water quality are two other important areas that benefit from citizen science. Several citizen projects have included citizens in measuring PM2.5 and PM10 related to SDG indicator 11.6.2 by using low-cost pollution monitoring sensors, such as the CITI-SENSE project, hackAIR, AirCasting and AirVisual (Fraisl et al. 2020). These citizen projects are valuable for detecting changes in previous levels of PM2.5 and PM10 and provide detailed spatial distributions across cities, which cannot be produced with the current density of official air monitoring stations.

In addition to supporting the existing system of SDGs, citizen science provides opportunities to contribute to the generation of additional goals and targets where gaps can be identified. Air quality monitoring demonstrates this potential. Currently, two SDG indicators are directly linked to air quality: (i) SDG indicator 3.9.1 on mortality rate attributed to household and ambient air pollution and (ii) SDG indicator 11.6.2 on annual mean levels of fine particulate matter (e.g., PM2.5 and PM10) in cities (population-weighted). Citizen science can fill this gap through the novel application of traditional sensors such as Palmes diffusion tubes (Haklay and Eleta 2019) and the ongoing efforts to develop reliable low-cost electrochemical sensors (Clements et al. 2017). CurieuzeNeuzen (Curious Noses) is a citizen science project involving the use of diffusion tubes to monitor air quality in Antwerp, Belgium. Engaging 2,000 participants, the project resulted in positive behavioural change in the participants while simultaneously driving political debate on air pollution and mobility measures (Van Brussel and Huyse 2019). Therefore, the opportunity exists to build a global network of projects that could be linked to a new indicator, which in turn could be used for future global environmental monitoring efforts.

6.2.3 Other forms of big data

Different sensor networks have been utilized for monitoring SDG indicators. For instance, air pollution monitoring stations are used by the World Health Organization to model particulate matter for SDG indicator 11.6.2, which then feeds into SDG indicator 3.9.1. The Global Ocean Acidification Observing Network[12] is used for monitoring ocean acidification for SDG indicator 14.3.1 on marine acidification.

Mobile phones can support the estimation of human mobility after disasters by using SIM card locators, which indirectly contribute to the measurement of SDG indicator 1.5.1/11.5.1/13.1.1 on people affected by disasters. Mobile phones can also inform population hotspots, social events and home locations, origin-destination flows and geo-social radiuses, which feed into SDG indicator 11.2.1 on the proportion of population that has convenient access to public transport.

6.3 Potential use of big data for disaggregated environment-related SDG indicators

Improving data disaggregation is fundamental for the complete implementation of the SDG indicator framework as it fulfils the 2030 Agenda pledge to leave no one behind. For environmentrelated indicators, the disaggregation would be extremely useful since most environmental variables do not follow national boundaries, and different groups of people have obvious differences in vulnerability, adaptability and responses to environmental problems (UNEP 2021b; Delli Paoli and Addeo 2020).

Understanding environment-related SDG indicators in different geographic locations can provide important information at the subnational, subadministrative, river basin and/or grid levels for realizing the SDGs. EO data, location-based survey or sensor network data combined with advanced analytical methods (e.g. machine learning, geospatial modelling) can be used for these types of disaggregation. For example, Fehri et al. (2019) used administrative data combined with irrigation data estimated by remote sensing to present a data-driven method allowing to disaggregate SDG indicator 6.4.1 on water stress to higher spatial and temporal resolution. In addition, satellite-based data are used as input climate data to global hydrological models (Sood and Smakhtin 2015). Fitoka et al. (2020) conducted an Object-Based Image Analysis approach based on Sentinel-2 and Landsat 5 TM satellite images to extract changes in the spatial extent of water-related ecosystems in the Greek Ramsar sites and their catchments in support of the basin-level disaggregation for SDG indicator 6.6.1. Leasure et al. (2020) developed a Bayesian modelling framework to produce a 10-metre spatial resolution national population data set that combined population data from recently conducted microcensuses with several geospatial covariates.

Environment-related SDG indicators disaggregated by demography carry great potential for understanding how different groups of people interact with the environment. For such types of disaggregation, survey data, citizen science, opinion (e.g. social media data) or behavioural data combined with statistical, cloud computing or deep learning methods can be used. For example, cell phone communications and airtime credit purchase history could assist in estimating the relative income of individuals, the diversity and inequality of incomes and an indicator for socioeconomic segregation for fine-grained regions, and then disaggregate indicators by different income levels (Blumenstock, Cadamuro and On 2015). Statistics Indonesia (2020) and a range of partners are using mobile positioning data to increase coverage and granularity for tourism statistics (12.b.1).

6.4 Challenges and possibilities

Big data offer a wide range of potential opportunities: cost savings, improved timeliness, greater granularity, link ability and scalability, improved international comparability, new dynamic indicators and more. Big data may offer solutions to data deficits in the developing world where traditional approaches have so far not reached the target of full data availability. But of course, big data also present risks and challenges for reporting on the SDG indicator framework.

a. Relevance

Until now, big data-based data sets have provided only partial or complementary data sets for monitoring official SDG indicators. Although these data sets have improved granularity and timeliness, their lower relevance has not been able to meet the demand of the NSOs in charge of reporting on the SDG indicator framework. In addition, other big data types, such as opinion and behavioural data, commercial data and administrative data, are mainly used for social and economic related SDG indicators, whose utilization for environment-related indicators is not well covered. Therefore, identifying big data-based data sets that have a clear link with SDG indicators will be of greater utility to national SDG monitoring institutions.

Policy relevance and operational application are imperative, as is the relevance to official indicator definition. The successful practices link global open access data sets with tools and e-learning courses to improve the practical skills of users. The World Bank’s Light Every Night open data repository provides open access to standardized and analysis-ready geospatial data combined with code, tools and training for countries or stakeholders to discover, process and analyse (WB 2020b). The global FreshWater Ecosystems Explorer (UNEP n.d.e) is being tested by countries to support national monitoring for SDG indicator 6.6.1 on freshwater extent. CBAS developed a suite of online calculation tools for SDG indicators (including 11.1.1 on urban population living in slums, 15.1.1 on forest area and 15.3.1 on degraded land, among others), which could support monitoring the global indicator framework and reporting for user-specified regions (CBAS n.d.c).

b. Accessibility

Many big data are proprietary, that is, commercially or privately owned and not publicly available. Consequently, many big data are not currently accessible, either because costs are prohibitive or proprietary ownership makes it difficult. For example, data generated from the use of credit cards, search engines, social media and mobile phones are all proprietary and often inaccessible. Most projects listed in the Big Data Inventory of the United Nations Global Working Group on Big Data for Official Statistics are pilot studies or remain in planning stages because of data inaccessibility (MacFeely 2019), except for those projects using EO and citizen science as data sources.

In this context, the introduction of FAIR (Findable, Accessible, Interoperable and Reusable) principles to SDG data management is imperative, requiring special focus on the future interoperability of data and data platforms. The geospatial community has embraced FAIR data principles and has long appreciated the need for accessible and interoperable data. Therefore, the provision of open-source and freely available satellite images and citizen science tools holds considerable potential (Fraisl et al. 2022b). Big data can be used through cloud computing and cloud-based data engines, which allow users to conduct analyses online without the need to download or upload any large data sets. Some global initiatives exist for improving the access and application of EO data (GEO, CEOS, UN-GGIM, EO4SDG and SDGSAT-1), along with citizen science initiatives that help accelerate SDG data acquisition and analysis. Organizations such as the Citizen Science Global Partnership, citizen science association, their working groups and current communities of practice in citizen science have worked actively with NSOs to bring citizen science into the scope of official reporting. For example, the communities of practice on citizen science and the SDGs mapped existing contributions of citizen science to SDG indicators and explored further contributions to additional indicators, as part of the WeObserve project (Fraisl et al. 2022b).

c. Validity and veracity

Big data face the uncertainty of long-term stability or maturity as well as their practicality as a data source for reporting on the SDG indicator framework. For instance, social media may tweak their services to test alternative layouts, colours or design, which in turn may mutate or distort the underlying data, making data inconsistent across users and/or time.

Another key challenge relates to methodologies used for big data (Struijs, Braaksma and Daas 2014), including representativeness and stability to be used in official statistics (MacFeely 2019). For instance, mobile or social media data comprise observational data and are not deliberately designed for data analysis. They do not have a well-defined target population, structure or quality, which makes it difficult to apply traditional statistical methods based on sampling theory; the unstructured nature makes it difficult to extract meaningful statistical information.

Concerns about veracity arise from the concentration of data platforms. For example, Reich (2015) notes that in 2010, the top 10 websites in the United States accounted for 75 per cent of all page views. Similarly, market dominance by a few companies introduces obvious risks of abuse and manipulation, raising serious questions for the continued veracity of any resultant data. Even for the EO data sets applications, predictions vary depending on the classifier and set of training and testing data used (Mondal et al. 2019). While these near-automated approaches can be applied to support decision-making across large regions, they also need to include uncertainty analyses, particularly in heterogeneous landscapes.

The development of best practice standards pertaining to methodology, quality and validation are urgently needed. The United Nations Global Working Group on Big Data for Official Statistics is investigating these issues. Currently, 10 rules of engagement exist for NSOs which can guide decisions around the use of big data sources in national official statistics (Tam and Van Halderen 2020). An outline is available about leading practice validation procedures and accuracy assessment for EO data used in big data analyses based on response design, sampling design and accuracy analysis (Marconcini et al. 2020). These provide potential frameworks and guidance for future consideration and validation of data sets to support national monitoring of the SDGs.

6.5 Conclusion


  • Data for SDG indicators are largely populated by traditional data from NSOs, other government ministries, official agencies and international organizations. However, data revolution carries great potential by using already available data sets in a structured manner and alongside traditional data. Such data can respond to the increasing demand for high-resolution spatial and temporal data and can be timely for decision-making. The development of principles on the use of big data is imperative to set the grounds for identifying usable, comparable, relevant and accessible data. This needs to be done in collaboration with NSOs and the international statistical community to identify and organize the potential use of big data to complement traditional data. The adoption of such principles by the international community needs to be followed by national policies to regulate and organize such a sector. This will require resource mobilization, partnership with the private sector as well as public engagement by consenting on the use of private data for the development of national statistics.

  • The development of new models that use big data and cuttingedge technologies for monitoring SDG indicators is needed. Based on methodological standards and validation procedures, these models ensure data set quality, thus addressing data gaps by providing high-quality and spatiotemporally consistent global SDG indicators data.

  • Utilizing big data for reporting on the SDG indicator framework requires improved skills and capacities to work with such cumbersome data sets, which in turn would require national capacity-building to acquire, process and utilize big data sources through tools, scalable applications and training or guidance for governments, users and manuals.


Chapters