
4. Freshwater-related ecosystems
Many relationships were identified as significant for freshwater-related ecosystems. The following chapter explores the significance of such relationships and whether such relationships are confirmed by scientific evidence.
4.1 Interlinkages analysis of freshwater-related indicators at the global level
4.1.1 The impact of drivers of change on the state of freshwater-related ecosystems
A set of SDG indicators were identified as drivers of change to have potential impact on freshwater-related indicators. Two indicators from the SDG framework (SDG 6.3.2 and SDG 6.6.1) were identified as state of freshwater-related ecosystems indicators. SDG 6.3.2, on the proportion of bodies of water with good ambient water quality, refers to “natural, untreated water in rivers, lakes and groundwaters and represents a combination of natural influences together with the impacts of all anthropogenic activities” (UNSD 2022a). The calculations for this indicator are based on in situ measurements from surface-water and groundwater samples. However, at the time of extracting the data to conduct the statistical analysis, only two data points were available (years 2017 and 2020), which hindered the analysis of the interactions of the drivers of change with this indicator. SDG 6.6.1, on the change in the extent of water-related ecosystems over time, is an indicator that monitors the expansion or shrinkage of lakes and rivers (permanent and seasonal water area), reservoirs, mangroves and wetlands. It is derived from satellite-based Earth observations (UNSD 2022a).
In addition to the drivers of change, a set of socioeconomic and environmental indicators were considered as part of the statistical analysis. The list of these indicators is presented in Annex D. The following section analyses the results obtained from the statistical analysis for freshwater-related indicators.

a. SDG 6.6.1 sub-indicators on lakes and rivers water area (permanent and seasonal)
SDG 6.6.1 aims to monitor the changes in size, water quality and quantity of water-related ecosystems, divided by type of ecosystem and by using satellite-based Earth observations. Two subindicators of SDG 6.6.1 are the water area of lakes and rivers, which are (a) permanent and (b) seasonal. These two sub-indicators are categorized as state of the ecosystems as they represent the expansion or reduction of water-related ecosystems. Between 2000 and 2019, these two indicators show an improvement in the water area of lakes and rivers, whether seasonal or permanent (SDG 6.6.1).
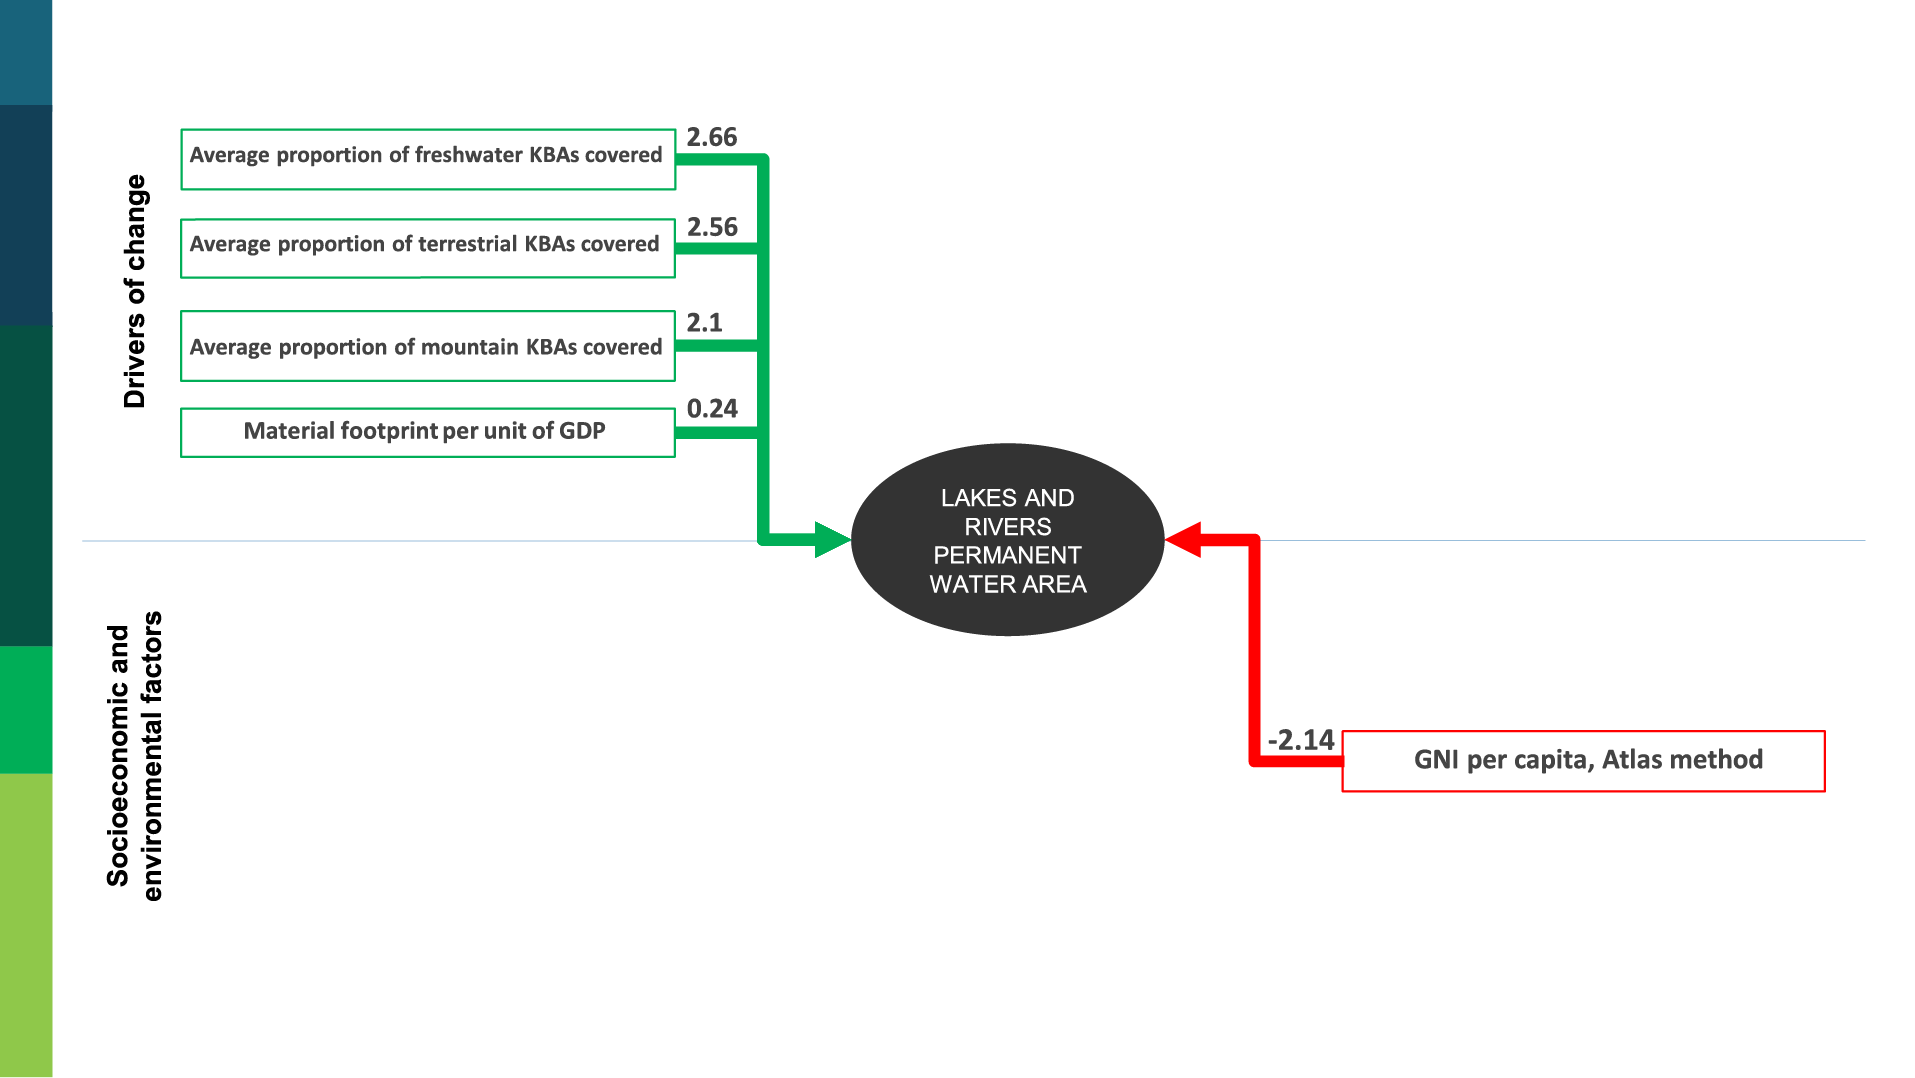
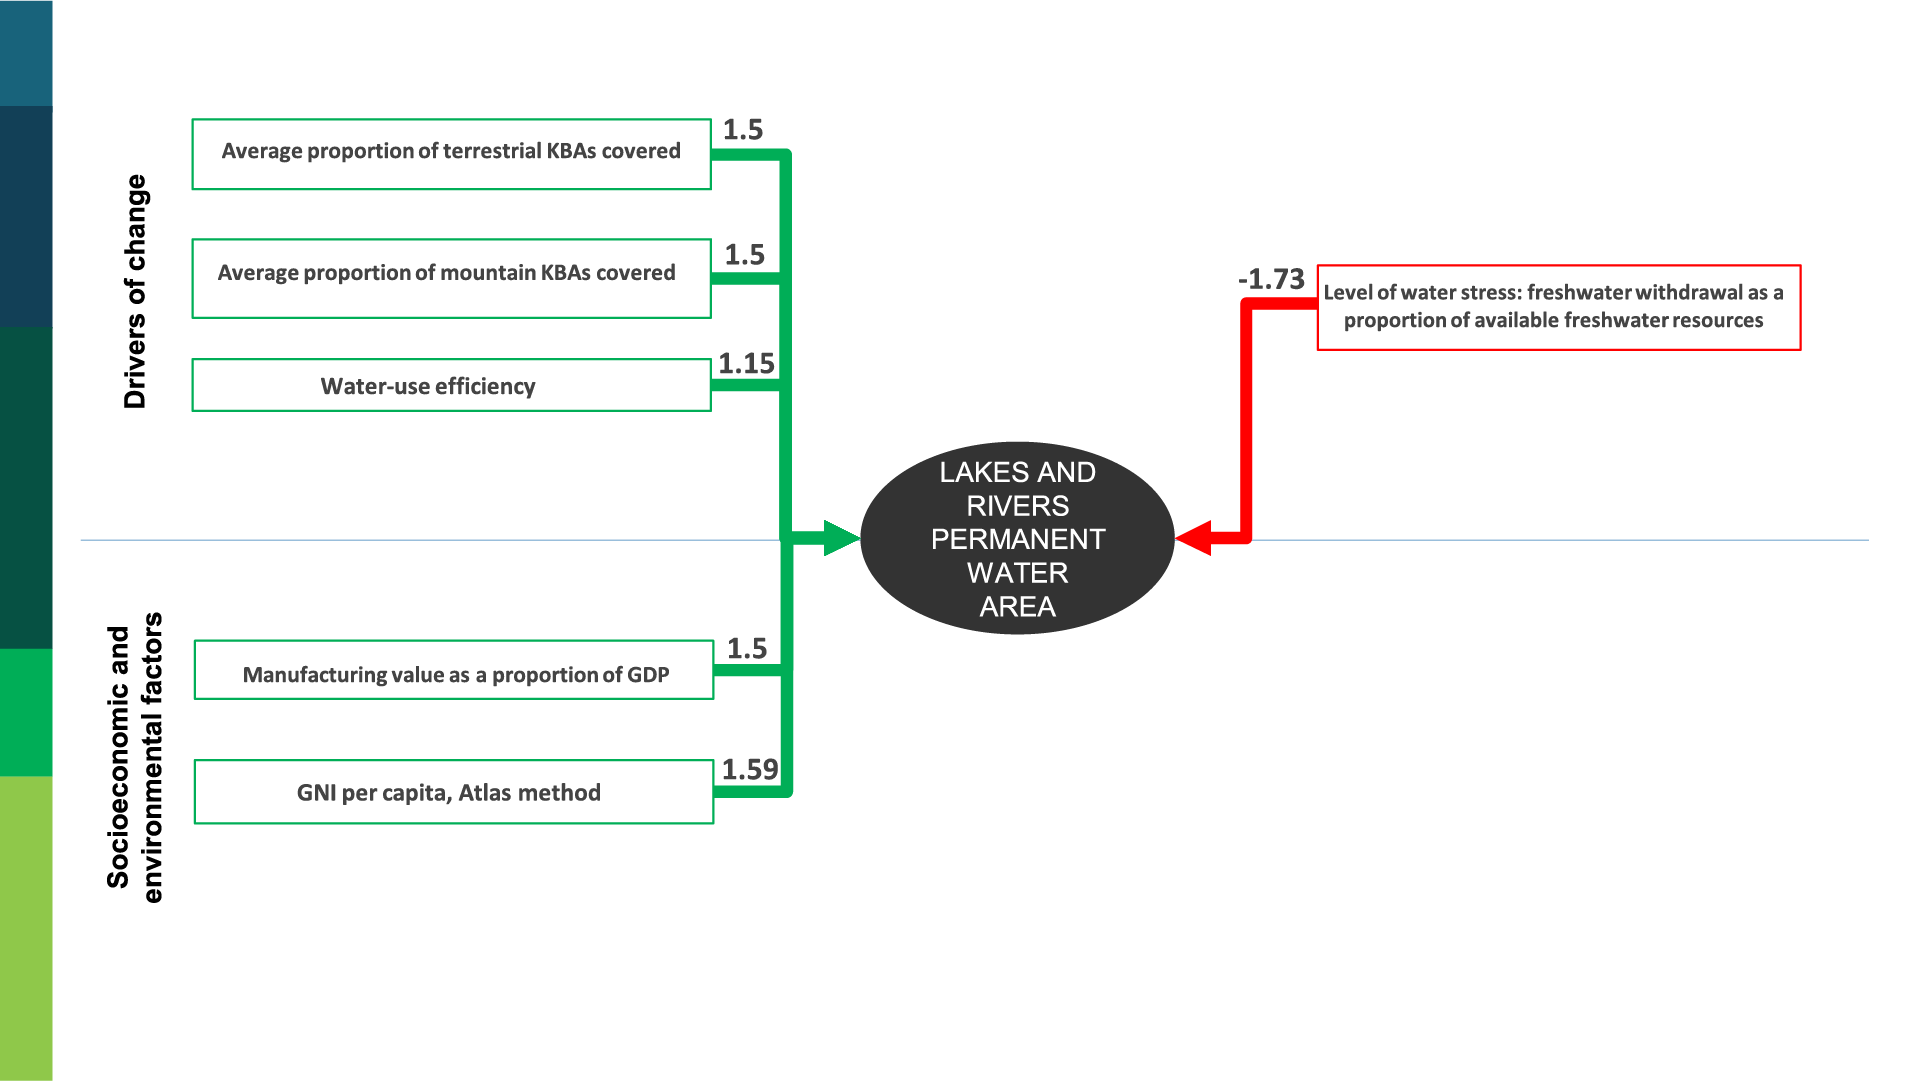
Three indicators (SDG 15.1.2 sub-indicators include the average proportion of freshwater KBAs covered and the average proportion of terrestrial KBAs covered; SDG 15.4.1 includes the average proportion of mountain KBAs covered) show positive impact on lakes and rivers permanent seasonal water area (SDG 6.6.1). Freshwater, terrestrial and mountain KBAs are “sites contributing significantly to the global persistence of biodiversity”, and the freshwater-related ecosystems represent one of the most threatened broad habitat types globally (Holland, Darwall and Smith 2012; Máiz-Tomé et al. 2017). In recent years, the global coverage of protected areas and core protected areas has shown a steady growth trend (Maxwell et al. 2020). At the same time, the global area of permanent water bodies is also in an increasing trend (Borja, Kalantari and Destouni 2020). On the other hand, freshwater-related ecosystems are highly dependent on the surrounding terrestrial areas, which include terrestrial and mountain KBAs as well as freshwater protected areas. For freshwater KBAs, terrestrial KBAs and mountain KBAs, the larger the area is, the larger the protected river and lake area is (Holland, Darwall and Smith 2012). Additionally, the more protected areas around freshwater-related ecosystems, such as lakes and rivers, the easier it is for water networks to propagate (Linke and Hermoso 2022). Therefore, freshwater, land and mountain KBAs show a strong positive relationship with the area of permanent and seasonal water bodies around the world.
The statistical analysis indicates a weak positive relationship between material footprint per unit of GDP (SDG 8.4.1/12.2.1) – which is a natural resources consumption-based indicator – and the lakes and rivers permanent and seasonal water area (SDG 6.6.1). As a resource, water is known to be used in the production of biofuels. These require significant volumes of water for the irrigation of crops (Convention on Biological Diversity [CBD] n.d.), which involves adding the volumes of water used during the actual process of extracting resources from the environment, leading to resource depletion and water pollution (Wiedmann et al. 2013). Given the quantities of water required in the mining sector, for instance, water-saving strategies and techniques are being developed in mineral processing plants to reduce and/or recycle the quantities of water required for extraction (Michaux et al. 2019), hence exerting less pressure on water streams such as lakes and rivers. The shift towards decoupling material extraction from water resources might be the reason for the positive relationship. However, in practice, the relationship is expected to be negative.
The statistical analysis resulted in a strong negative relationship between GNI per capita, Atlas method[9] and lakes and rivers permanent and seasonal water area. Strong income growth leads to rising living standards and more demands for commodities (WWAP 2015). This all leads to increased water use, which exerts greater pressure on the available water resources (lakes and rivers) and reduces the water available to meet the increasing demand from economic activities and households alike. This can be interpreted by the negative relationship where an increase of GNI per capita might decrease the lakes and rivers permanent and seasonal water area (SDG 6.6.1). At the global level, this indicates that decoupling economic growth from water resource use has not yet been accomplished. However, since data used is aggregated to the global level, one cannot assume that decoupling has not been achieved in any country.
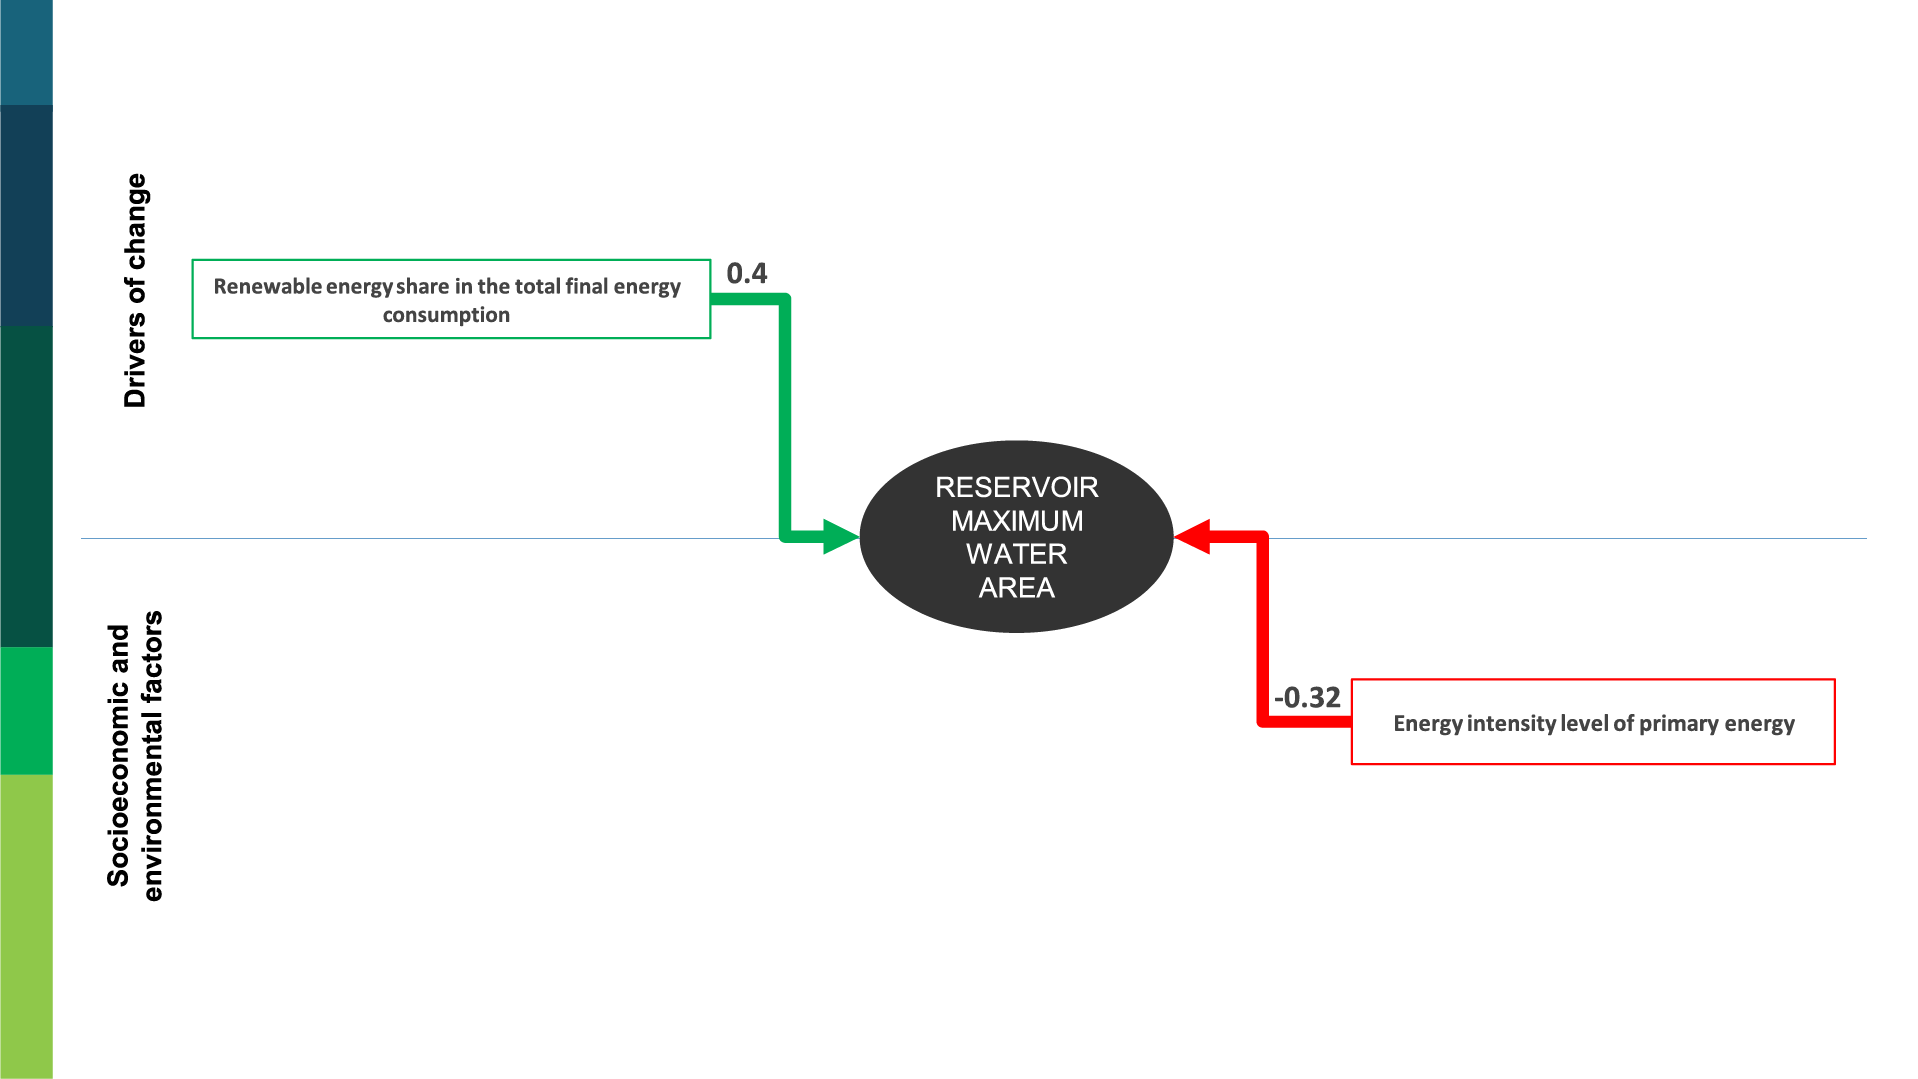
Renewable energy sources include hydropower, solar, wind, geothermal, bioenergy, wave and tidal. Globally, hydropower is by far the largest modern renewable energy source, but with solar and wind power rapidly growing, hydropower development is reduced, bearing a positive impact on the maintenance of seasonal water bodies (He et al. 2019). According to International Renewable Energy Agency [IRENA] statistics (IRENA 2022a), the world annual growth in electricity-generating capacity from hydropower sources since 2000 has been much slower (ranging between 1 and 4 per cent per year) compared with wind and solar generating capacities. Solar and wind generating capacities combined accounted for more than the hydropower capacities worldwide in 2020 (IRENA 2022a). On the other hand, expanding the renewable energy capacities, more specifically solar and wind as these sources are not water intensive, coupled with reduced extraction and processing of fossil fuel, leads to improvement in lakes and rivers water area (SDG 6.6.1). This can be related to the weak positive relationship between (a) renewable electricitygenerating capacity (SDG 7.b.1), (b) renewable energy share in the total final energy consumption (SDG 7.2.1) and (c) the proportion of population with access to electricity (SDG 7.1.1) as well as lakes and rivers seasonal water area. Similarly, SDG 7.3.1 on the energy intensity level of primary energy consumption (representing the total energy supplied to the economy per unit value of economic output) is expected to have a negative relationship with lakes and rivers seasonal water area (SDG 6.6.1), as the decrease in energy intensity is considered beneficial to the environment, which is the case in the obtained results.
Figure 4.1 General model for lakes and rivers permanent water area, global level
On the other hand, (a) domestic material consumption per unit of GDP (SDG 8.4.2/12.2.2) and (b) manufacturing value added as a proportion of GDP (SDG 9.2.1) were identified as having a negative relationship with lakes and rivers seasonal water area (SDG 6.6.1). The expansion of the manufacturing sector requires more natural resources (that is, more water) unless environmentally sound techniques are used. Additionally, the less domestic material consumption to produce one economic output, the better it is for natural resources, as processes are becoming more efficient, requiring fewer natural resources to be allocated and a lower energy requirement to produce the same quantities of products. This explains the negative relationship between SDG 8.4.2/12.2.2 and SDG 9.2.1 obtained from the statistical analysis.
The statistical analysis has shown that increased electronic waste generated per capita (SDG 12.4.2) has a negative relationship with lakes and rivers seasonal water area (SDG 6.6.1). In fact, global e-waste generated per capita has been increasing to reach 7.3 kilograms (kg) in 2019 and is expected to reach 9 kg per capita in 2030 (Forti, Baldé, Kuehr and Bel 2020). The rapid innovation in new technologies requires a fast-paced electronics production. The production of electronic products depends on the mining and extraction of a different variety of metals. The extraction and transformation of these metals to be used in products (via mining, grinding, flotation, gravity concentration, medium separation and hydrometallurgical processes) and auxiliary activities (e.g. dust suppression, cooling and washing equipment) are water-intensive processes, not forgetting the water used for energy (drilling, cooling and emission control systems at thermoelectric power plants) (Madaka, Babbitt and Ryen 2022). This has led to water depletion in surrounding water bodies and degradation of water downstream of mining sites (Madaka, Babbitt and Ryen 2022), which reflects the results of the statistical analysis. However, it is uncertain why such a strong negative relationship was not found to be statistically significant in lakes and rivers permanent water area (SDG 6.6.1).
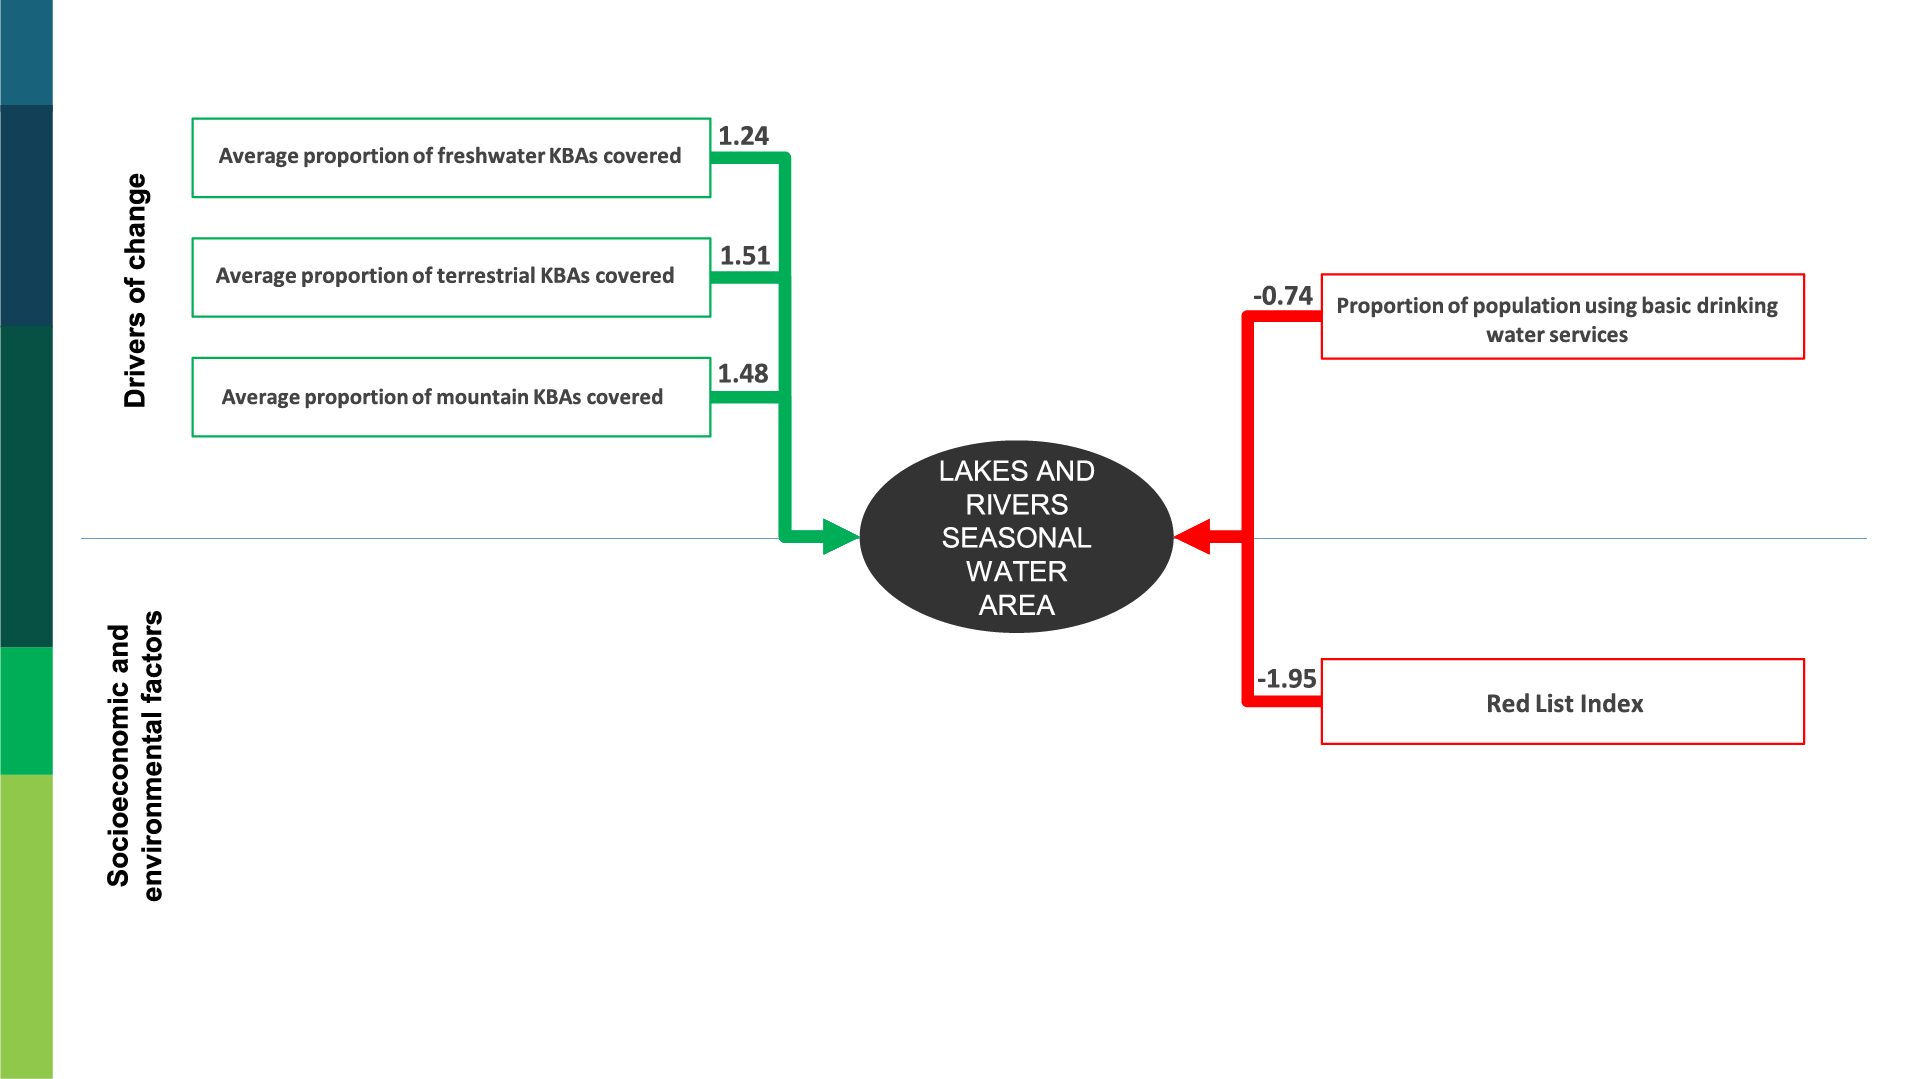
Figure 4.2 General model for lakes and rivers seasonal water area, global level
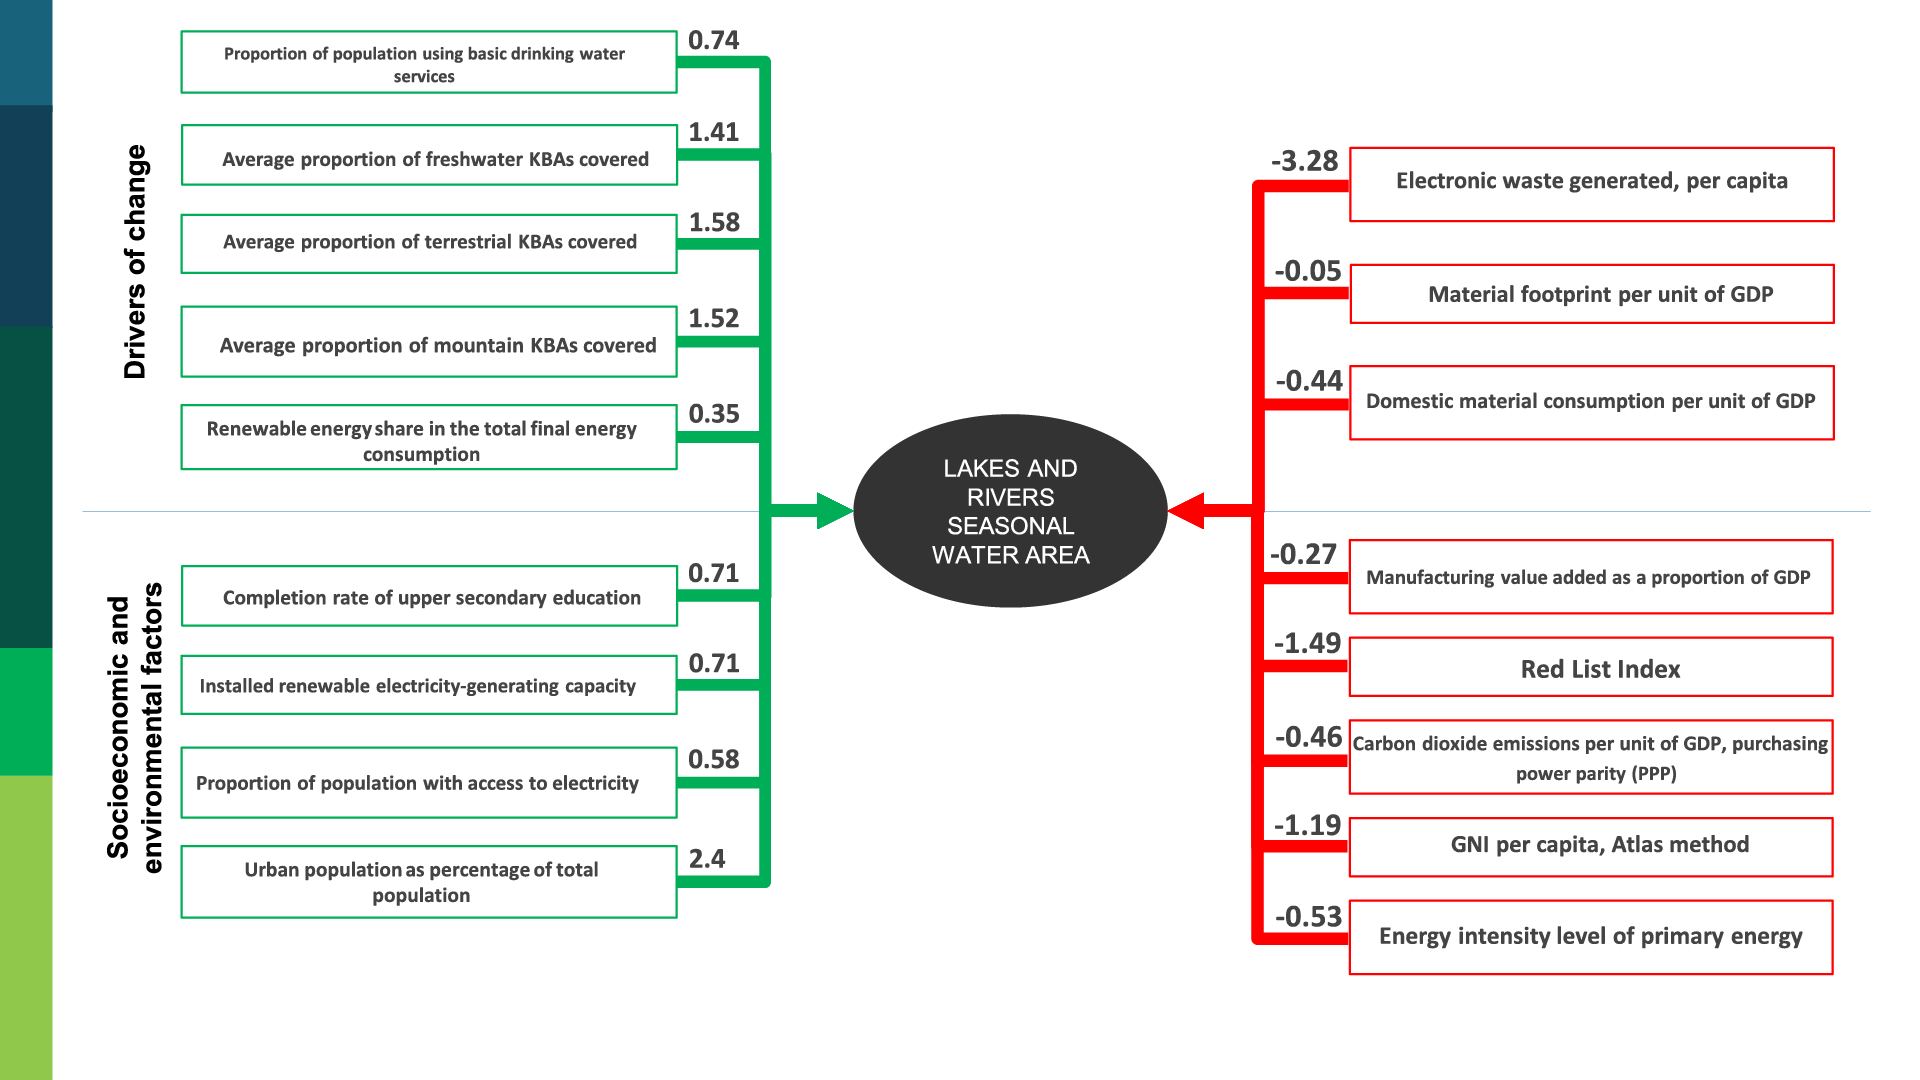
The statistical analysis has shown a positive relationship between the proportion of population using basic drinking services and lakes and rivers seasonal water area. Basic drinking water services is defined as drinking water from an improved source, provided collection time is not more than 30 minutes for a round trip, from piped water, boreholes or tube wells, protected dug wells and springs, and packaged or delivered water (UNSD 2022a). The higher the population with access to water resources, the higher the pressure exerted on natural resources to allocate more quantities of water. However, the increase in the proportion of population using basic drinking water services might imply fewer people using water by other inefficient means, such as household leaks (EPA 2022), or by wasteful means, such as running the tap while brushing their teeth or washing their hands or the dishes (EPA 2022).
Urbanization, specifically rapid urbanization, will lead to the reduction of surface water (Palazzoli, Montanari and Ceola 2022). In many urbanized areas, surface and ground waters are already depleted (WWAP 2015). This is due to an increased demand for manufacturing, thermal electricity generation and domestic use resulting from growing urban populations in developing countries (WWAP 2015). Yet, the move to urban areas leads farmers to leave their agricultural activities which in turn leads to decreased water needs for the agriculture sector, which could be the reason for the positive relationship.
A negative relationship between CO2 emissions per unit of GDP (SDG 9.4.1) and lakes and rivers seasonal water area (SDG 6.6.1) was identified. As the efficiency in economic processes improves, meaning less CO2 emissions to produce one unit of economic output, fewer quantities of water are required, and less pressure is exerted on water-related ecosystems. This reflects the results of the statistical analysis for lakes and rivers seasonal water area. What remains obscure is that this relationship was not identified as statistically significant with rivers and lakes permanent water area.
b. SDG 6.6.1 sub-indicators on reservoirs water area (minimum and maximum)
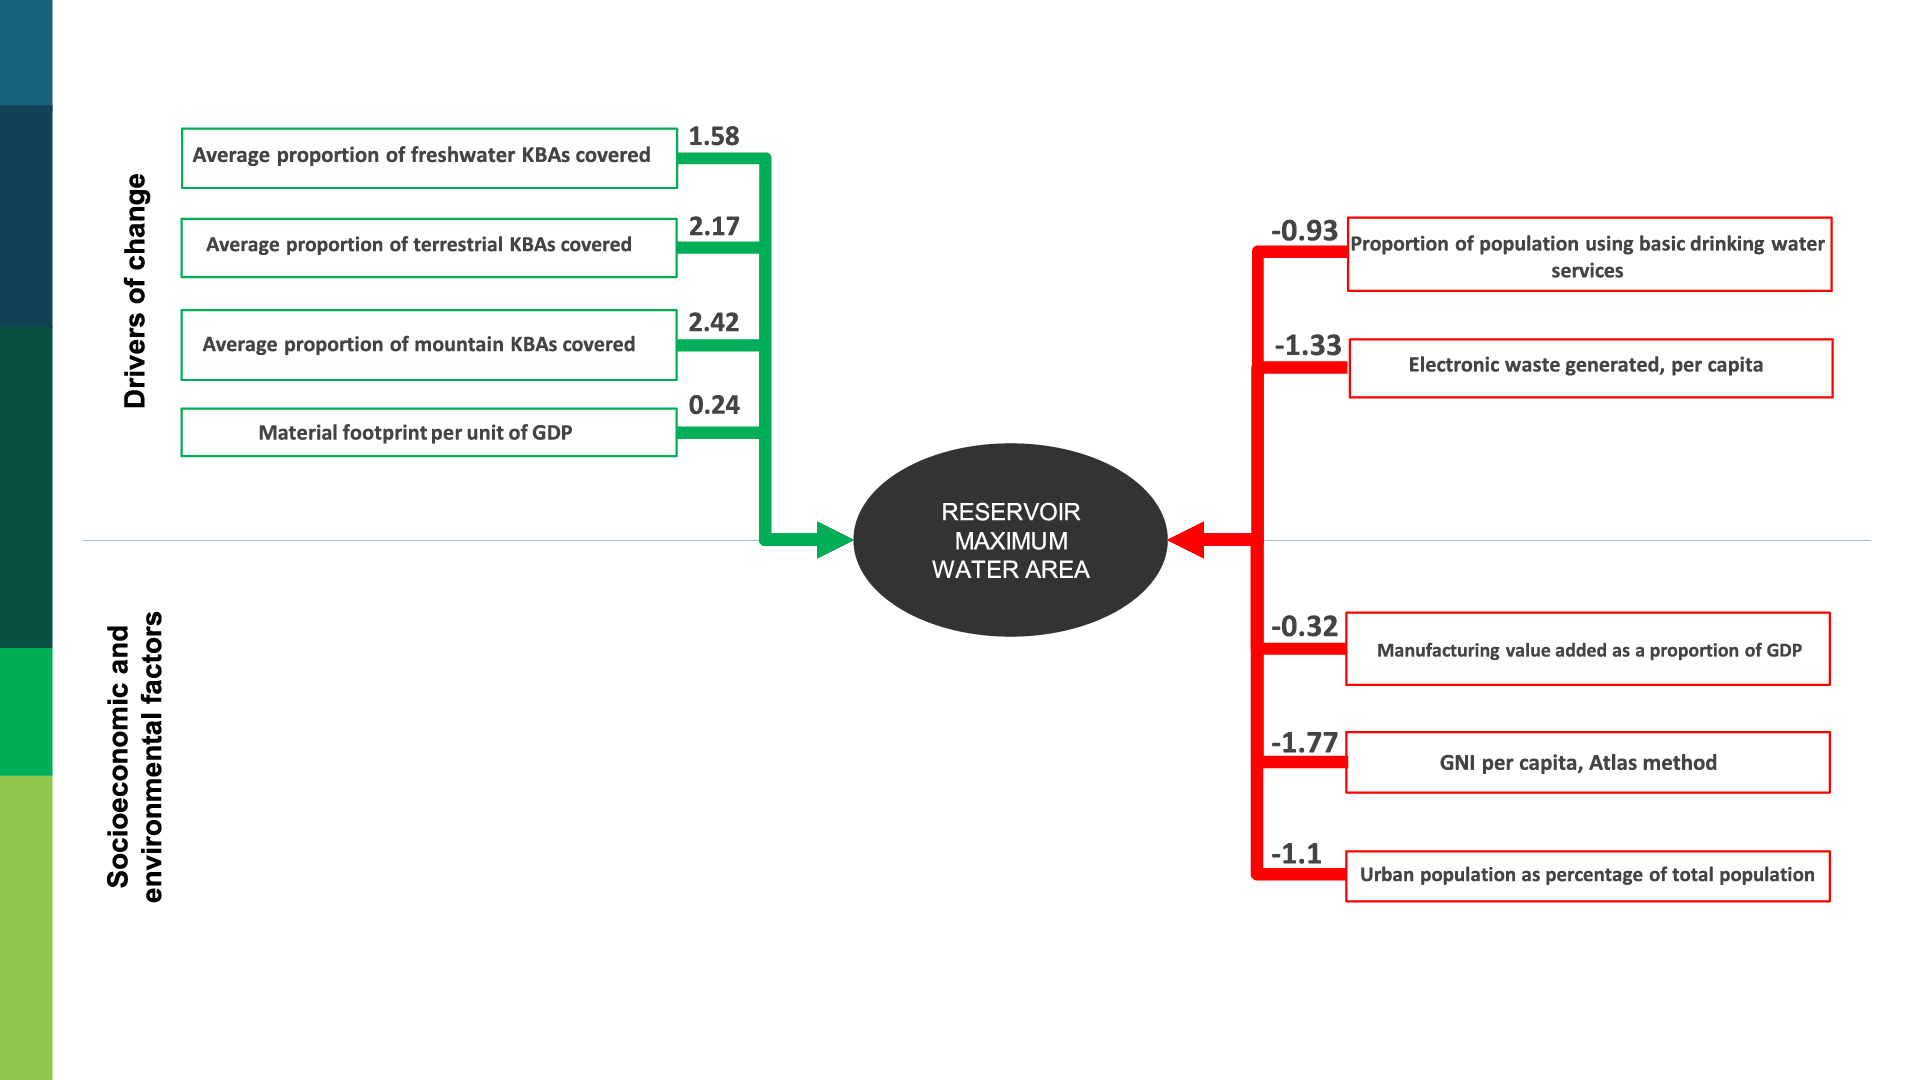
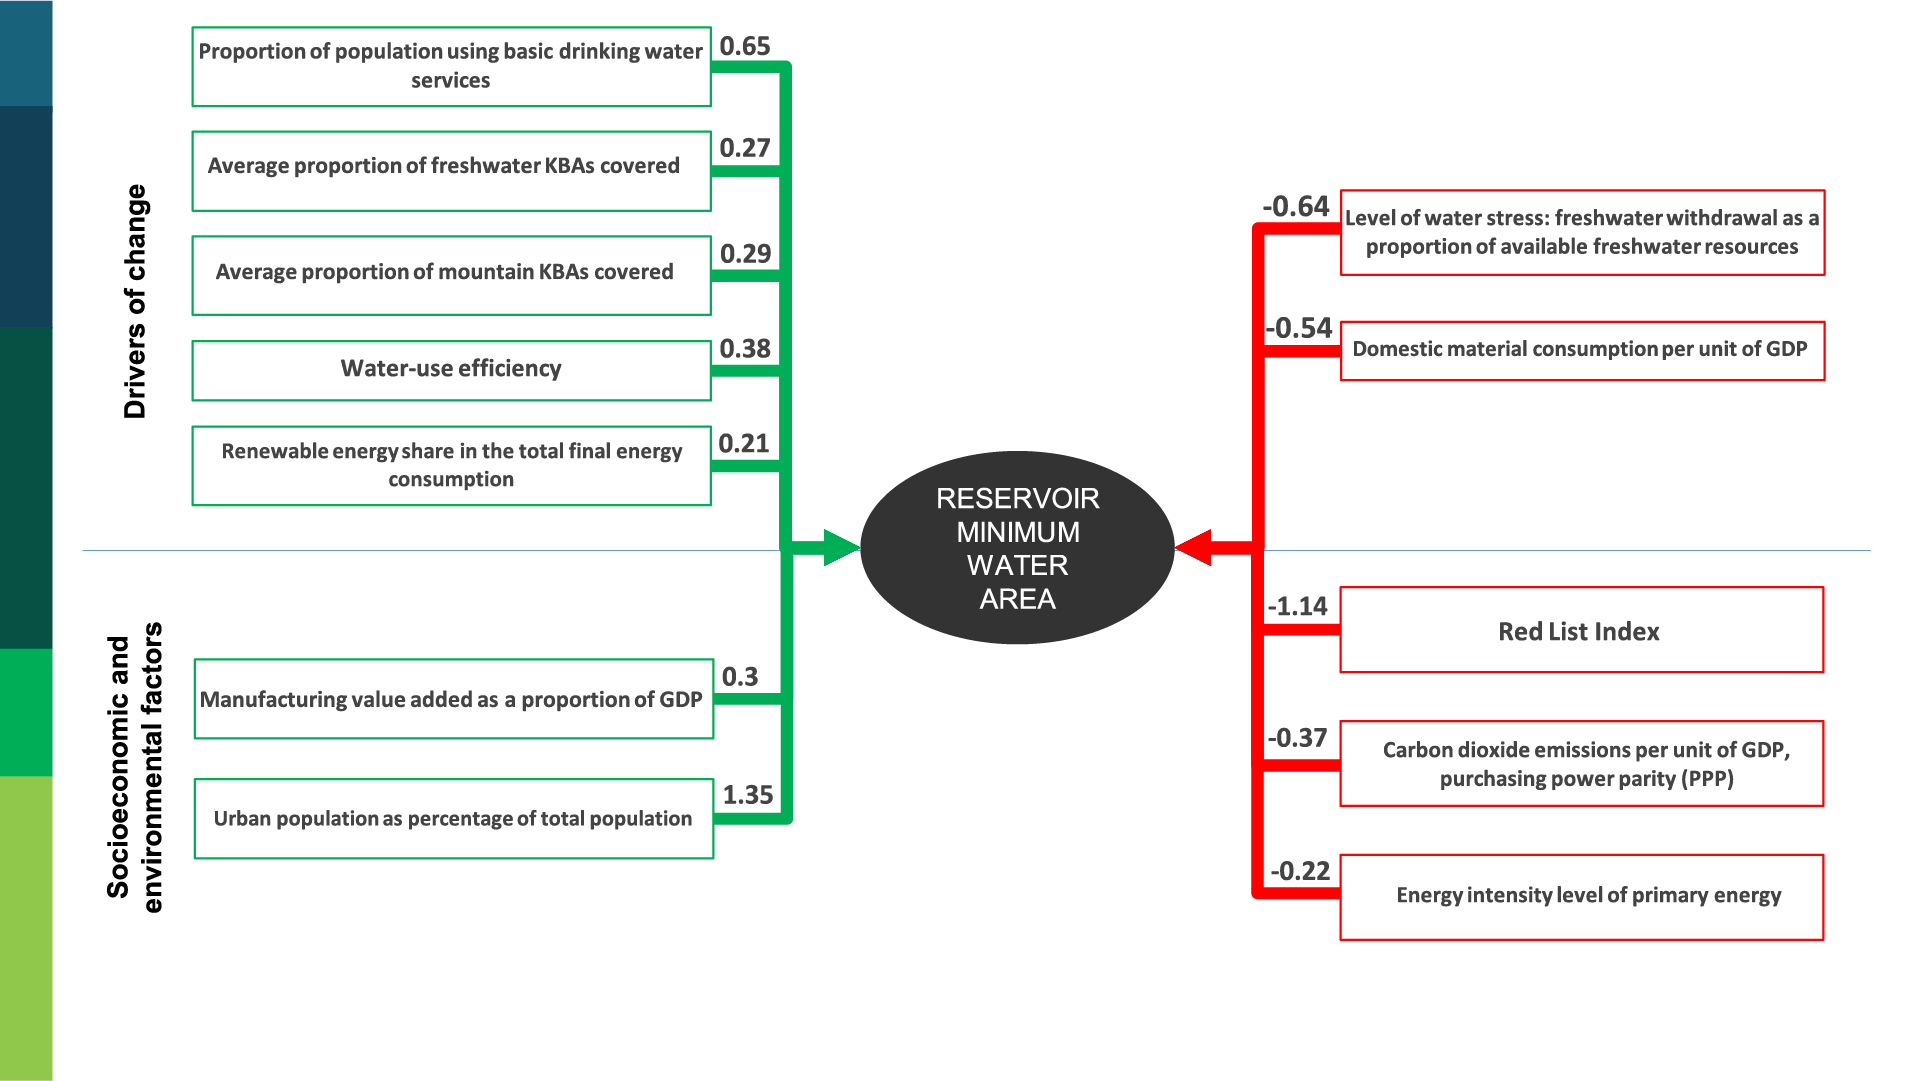
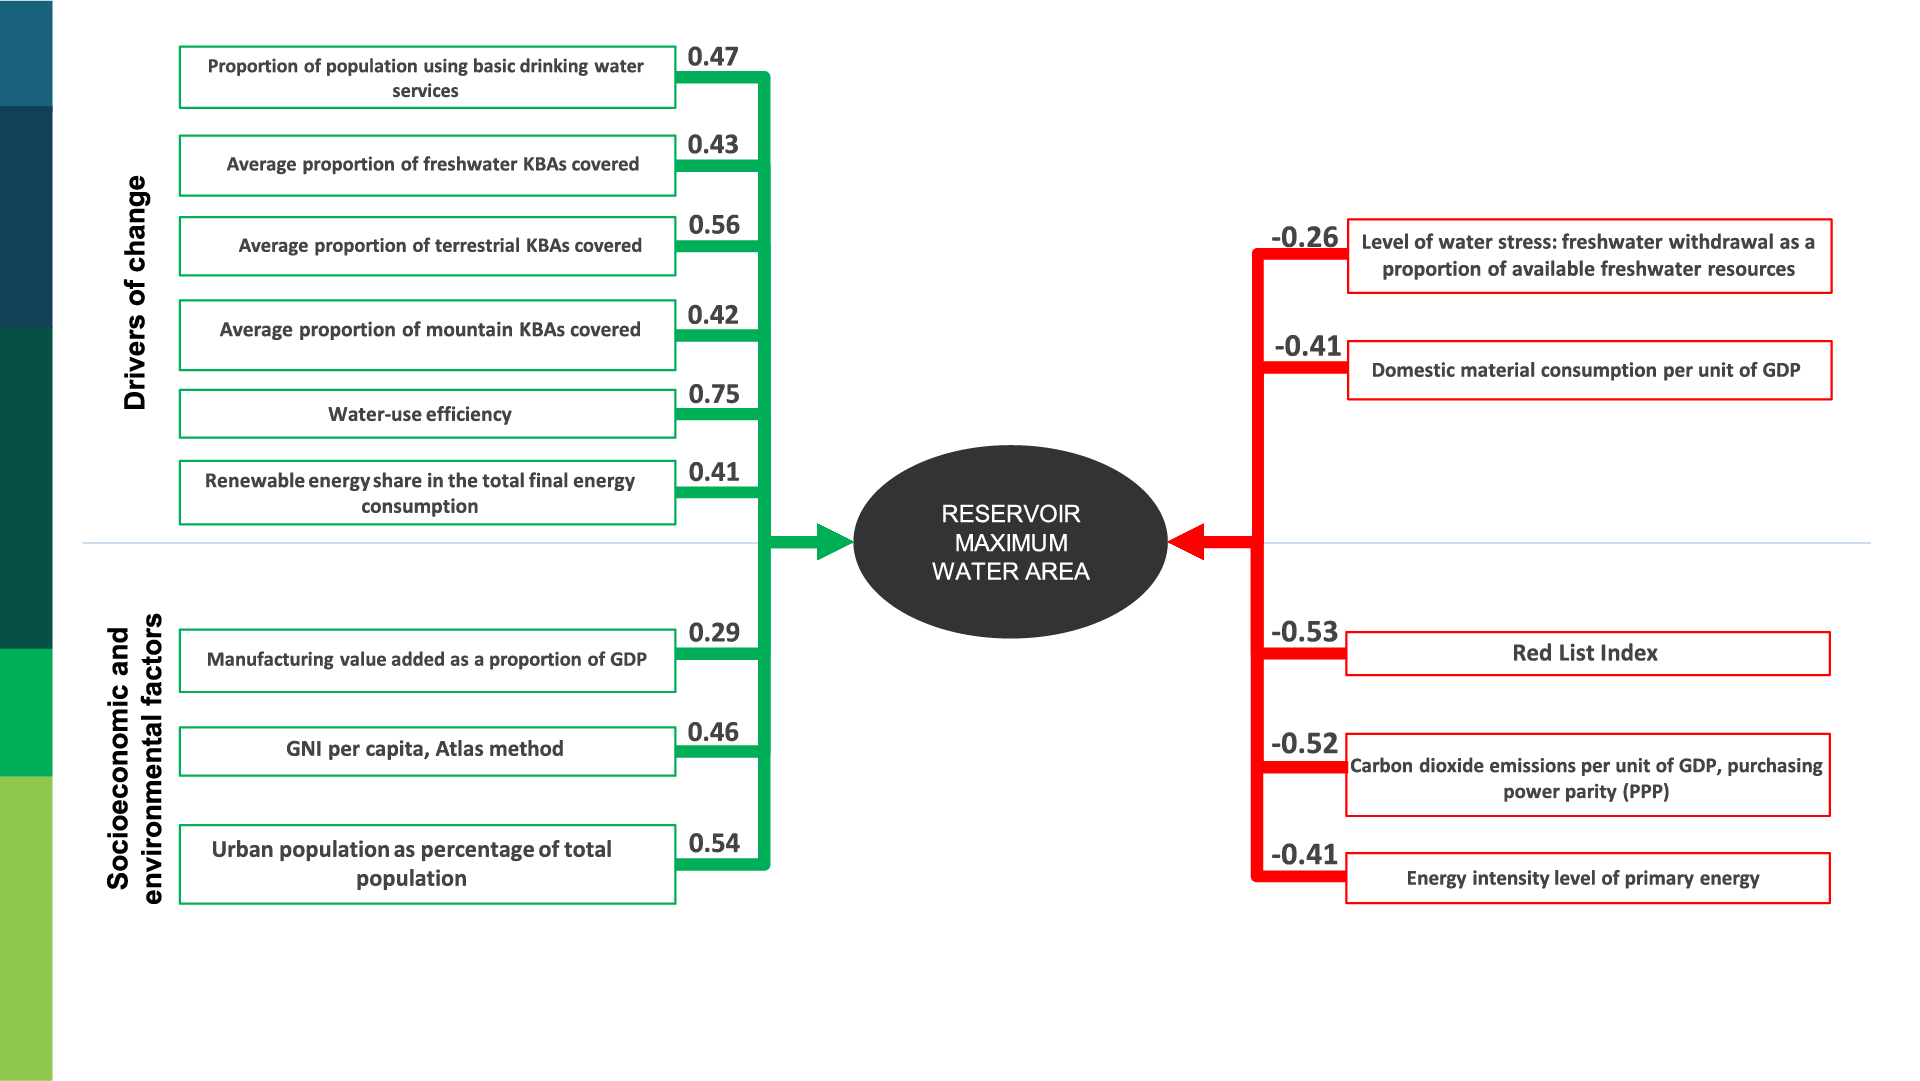
Reservoirs are artificial waterbodies built by humans for purposes such as water supply, hydropower generation, flood control and irrigation. In both SDG 6.6.1 sub-indicators on reservoirs water area (a) minimum and (b) maximum, the statistical analysis showed the same type of relationships with independent indicators. For instance, there was a positive relationship between (a) the average proportion of mountain KBAs covered (SDG 15.4.1), (b) the average proportion of terrestrial KBAs covered (SDG 15.1.2) and (c) the average proportion of freshwater KBAs covered (SDG 15.1.2) with both reservoirs minimum and maximum water area (SDG 6.6.1). These three indicators show the strongest impact on reservoirs water area. As presented in the section on lakes and rivers, conservation efforts carry a positive impact on freshwater resources, which include reservoirs water area.
Regarding SDG 8.4.1/12.2.1 on material footprint per unit of GDP, the statistical analysis shows a weak positive relationship with reservoirs minimum and maximum water area (SDG 6.6.1). As presented in the lakes and rivers section, this relationship is expected to be negative.
A strong negative relationship was also identified between electronic waste generated per capita (SDG 12.4.2) and reservoir minimum and maximum water area (SDG 6.6.1). As provided in lakes and reservoirs section, the production of electronic equipment is water intensive, which means that the more electronic equipment is generated, the more water is required to produce them. In addition, the innovations in that sector coupled with a consumer behaviour has led to the generation of more electronic waste – a significant source of water pollution (Akram et al. 2019).
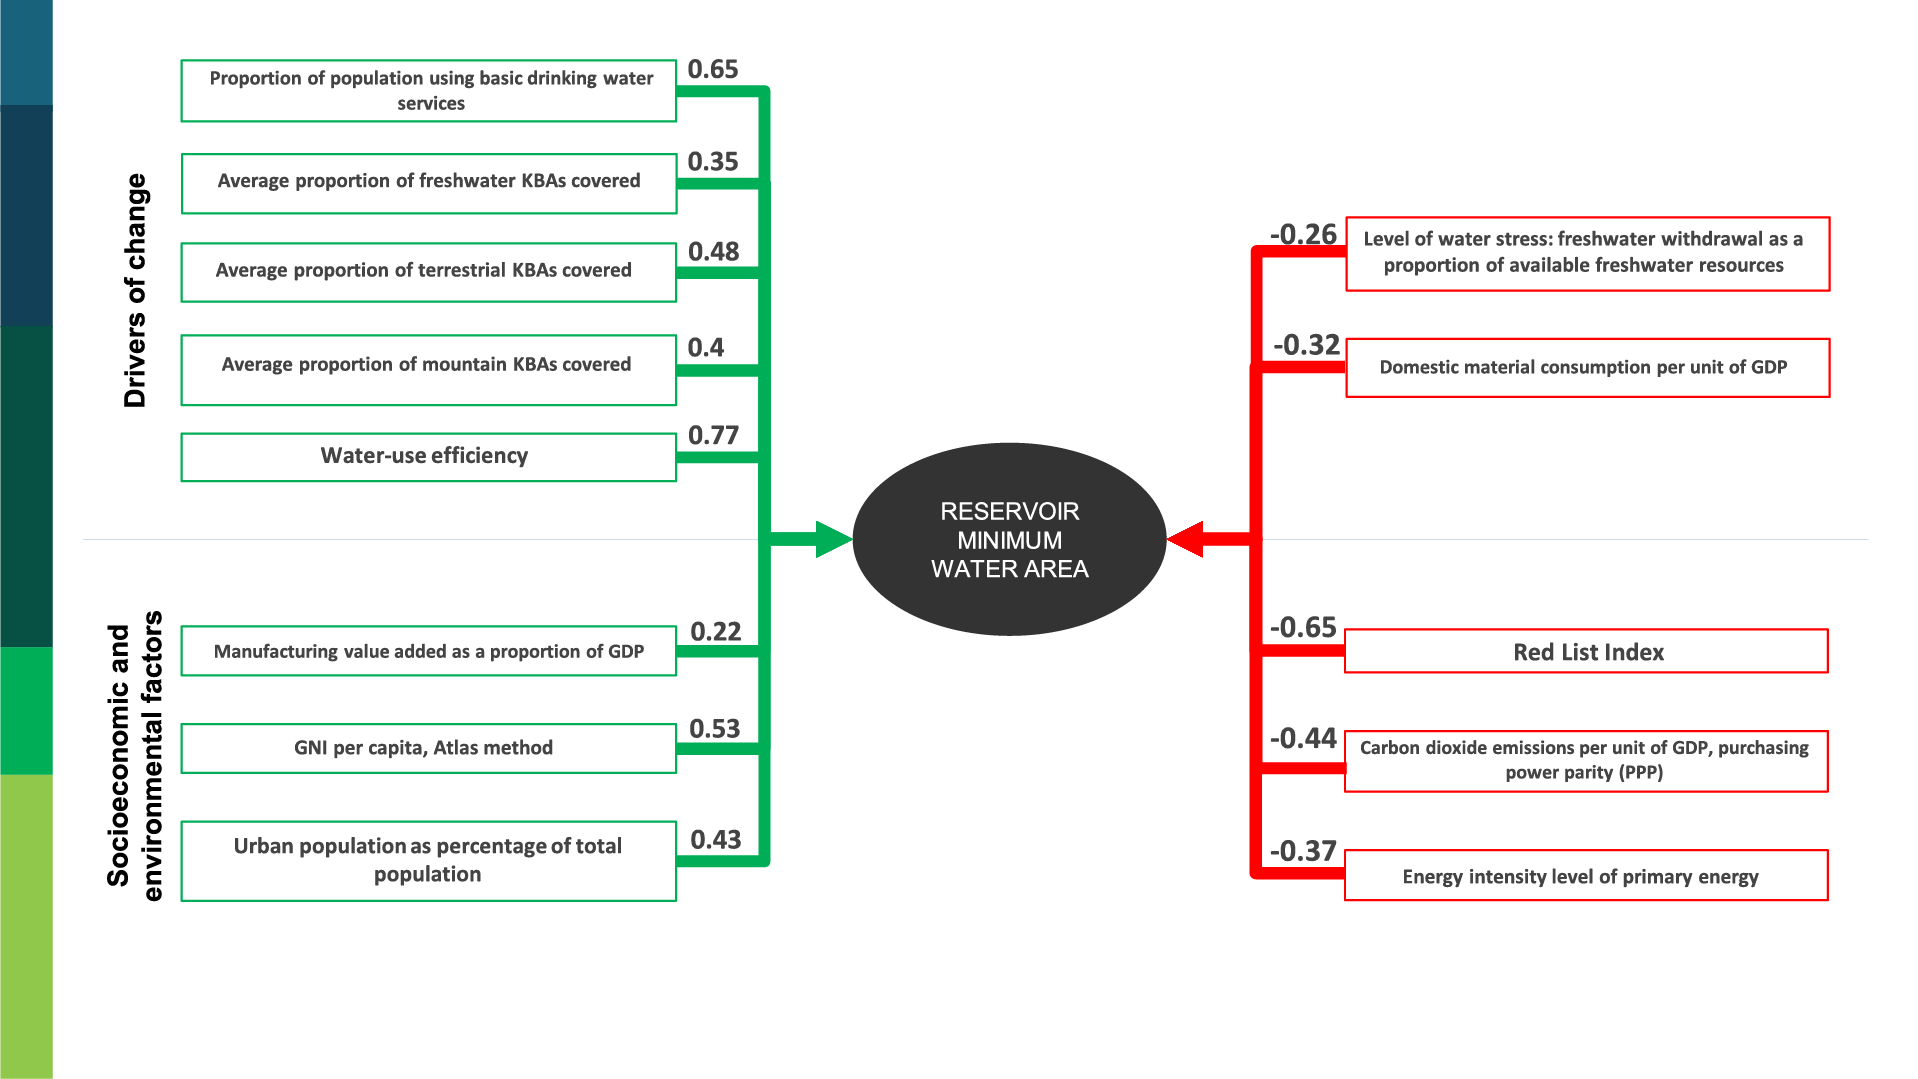
Figure 4.3 General model for reservoirs minimum water area, global level

The statistical analysis has indicated a negative relationship between (a) GNI per capita, Atlas method, (b) SDG 1.4.1 on the proportion of population using basic drinking water services and (c) urban population as a percentage of total population and reservoir maximum and minimum areas (SDG 6.6.1). The increase in the GNI per capita leads to improved lifestyles with increased water consumption. As one main aspect of a reservoir is to supply water for households, industries and agriculture, this also means that increased per capita income, increased urban population as a percentage of total population and an increased proportion of population using basic drinking water services would negatively impact the water area of reservoirs used to supply such communities, which is presented by the negative relationship.
Figure 4.4 General model for reservoirs maximum water area, global level
c. Conclusion
-
At the global level, many indicators showed positive or negative relationships with SDG 6.6.1 sub-indicators on lakes and rivers permanent and seasonal water area and on reservoirs minimum and maximum water area. Among the positive relationships, land conservation indicators were strongest, consistent with the expectation that land conservation is also a water protection effort. A weak positive relationship with material footprint per unit of GDP (SDG 8.4.1/12.2.1) was identified, which may indicate that the world is moving closer towards a decoupling of economic activities from resources use, though it is expected to be negative.
-
The strongest negative relationship was identified between GNI per capita and lakes, rivers and reservoirs water area (SDG 6.6.1). As global GNI per capita grows, leading to more water use, decoupling water resources from economic growth has become essential to preserve surface-water and groundwater resources. One costeffective way to achieve this decoupling is for governments to develop and implement integrated water resources management strategies at national, subnational and basin levels (UNEP 2016c). Electronic waste generated per capita (SDG 12.4.2) was also found to have significant strong negative relationship with water resources. This implies the need for stronger policies targeting the production and management of electronic wastes, both within national borders and transboundary, more specifically focusing on the potential of recycling or reusing materials in the context of shifting from a linear to a circular economy.
-
Reservoirs water area (SDG 6.6.1) were negatively impacted by the proportion of population using basic drinking water services (SDG 1.4.1) and the percentage of urban population. Although accessing clean drinking water is a basic human right, the focus of better access lies in increasing the efficiency of water use or water infrastructure including water supply networks. Such actions require national water policies that target water infrastructure, regulatory systems and water use.
4.1.2 State of freshwater-related ecosystems’ impact on state of human well-being

a. SDG 1.1.1 sub-indicator on the proportion of population below international poverty line
SDG indicator 1.1.1 on employed population below the international poverty line monitors the share of employed persons living in households with per capita consumption or income that falls below the international extreme poverty line of US$ 1.90 per day (UNSD 2022a).[10] This indicator’s main target is to reduce the proportion to zero, thereby eradicating extreme poverty. The adequacy of earnings and income is a fundamental aspect of human rights and essential in alleviating poverty across the world (Sullivan and Hickel 2023). Gender analyses of poverty-related data indicate that women constitute the majority of the world's poor. Such information is crucial to ensuring that poverty eradication efforts focus on the inclusion of women as key stakeholders as well as in economic empowerment activities such as environmental management and governance.
A total of four state of the ecosystem indicators were identified to have negative relationships with SDG 1.1.1. The negative relationships between water quantity and poverty are well recorded in the literature. Reduced water availability or water scarcity exacerbates the consequences of poverty (Gleick and Cooley 2021). The 2016 edition of UNESCO’s World Water Development Report (WWAP 2016) states that unsustainable water management, in addition to other natural resources, causes significant harm to economies and society by reversing poverty reduction gains. Additionally, women and girls tasked with water collection spend more of their time collecting water for domestic consumption rather than in pursuit of education or economic empowerment, further pushing them into poverty and sometimes putting them in danger when the water source may be in a secluded or conflict-torn area.
Water, as well as being a basic necessity, benefits society and communities in the form of ecosystem services that help create jobs related to water, including agriculture or aquaculture in freshwater streams, which alleviate poverty. Studies have noted that aquaculture has the potential to help alleviate poverty, especially in areas where there is sufficient freshwater or even marine water available for aquaculture. In the Philippines, poverty among farmers unengaged in aquaculture was found to be around 71 per cent while poverty among farmers engaged in aquaculture of small-scale tilapia was around 43 per cent (Palanca-Tan 2018- 2019). Such proclamations and impacts of water availability on the proportion of employed population below the international poverty line (SDG 1.1.1) confirm the results of the statistical analysis about the negative relationship.
Figure 4.5 General model for employed population below international poverty line, global level
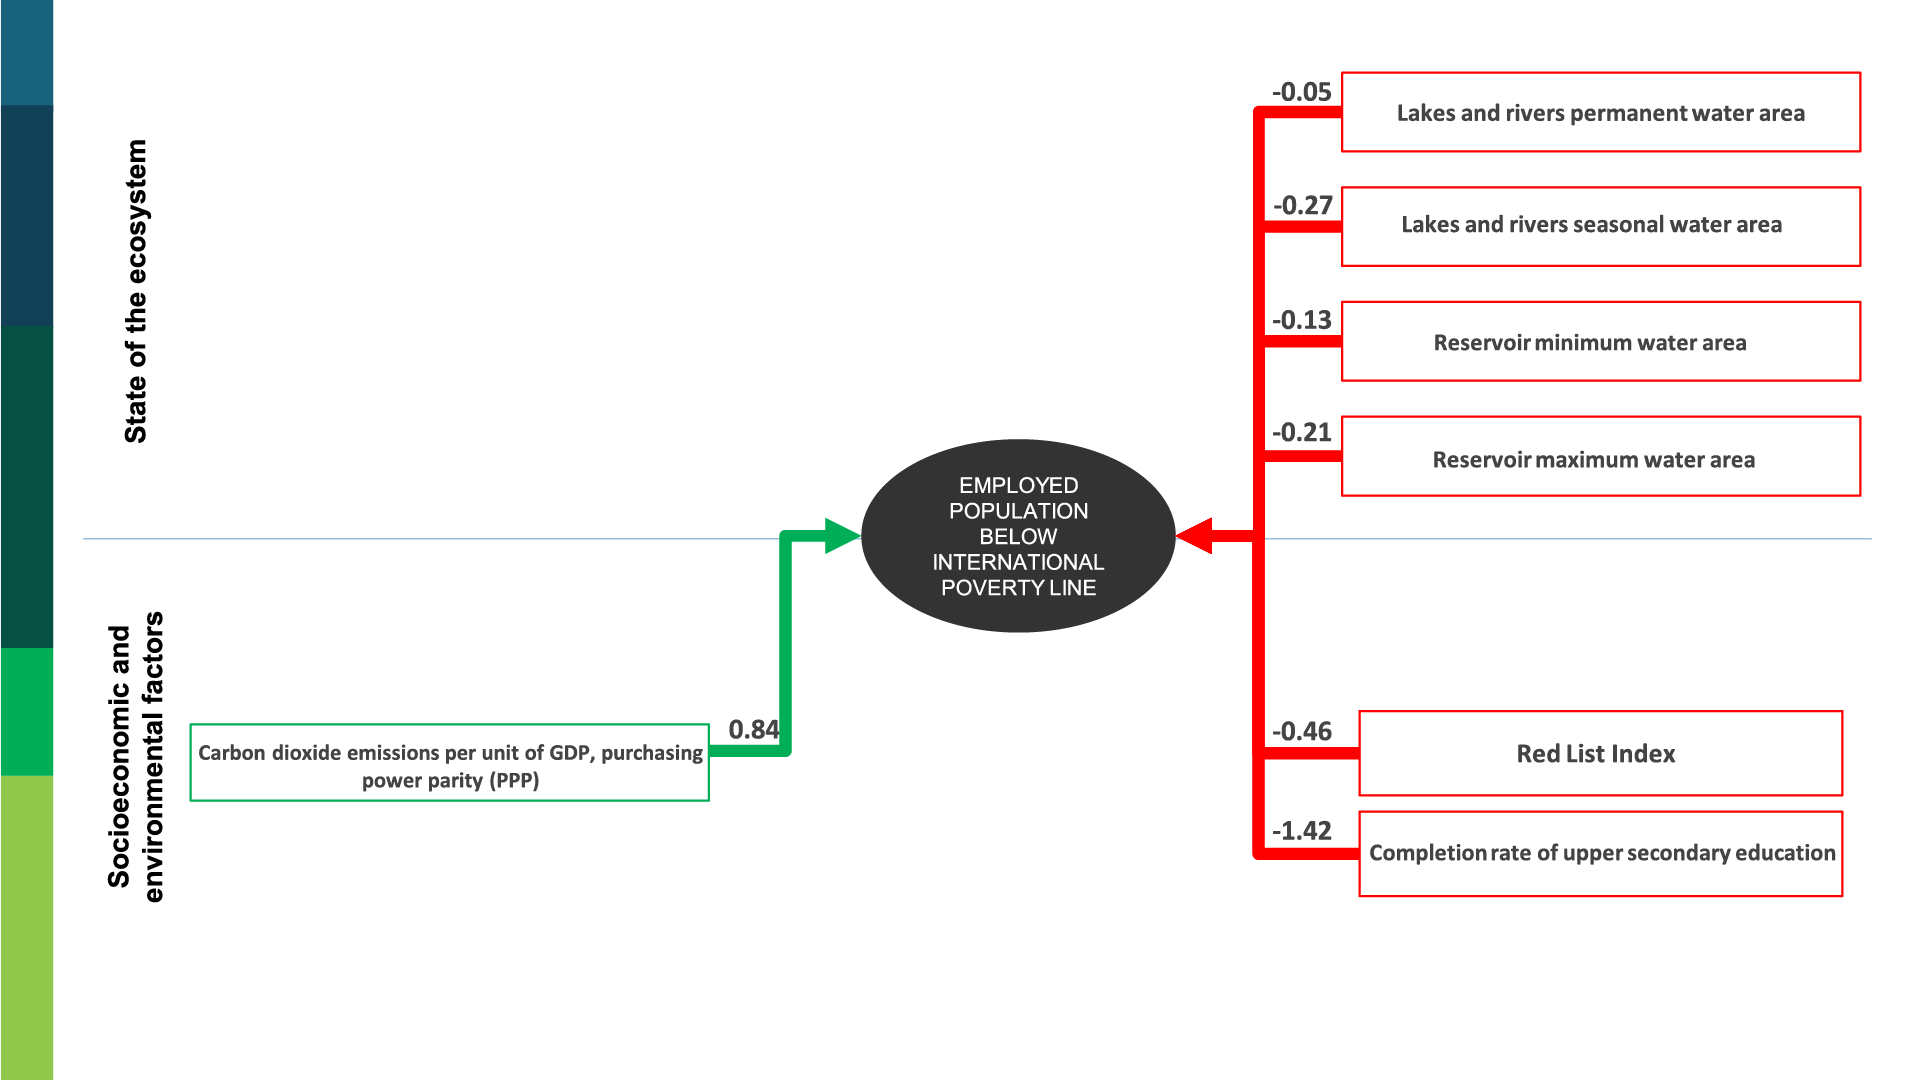
The statistical analysis identified one positive relationship between SDG 9.4.1 on CO2 emissions per unit of GDP and SDG 1.1.1 on employed population below the international poverty line. Much research across the literature discusses the impact of CO2 emissions and its role in alleviating poverty (Hubacek et al. 2017; Bruckner et al. 2022). Both studies found that lifting people out of extreme poverty (US$ 1.90 per day) would not jeopardize the climate target, as it would only result in an increase of 1.6 to 2.1 per cent or less of carbon emissions. However, no literature studies could be found on CO2 intensity and its impact on proportion of population below the international poverty line, making it a challenge to interpret the results.
The statistical analysis has identified a strong negative relationship between the completion rate of upper secondary education (SDG 4.1.2) and the proportion of employed population below the international poverty line (SDG 1.1.1). “Water education is often linked with poverty eradication…” (UNESCO 2009). Skills development, through school learning reduces poverty and unemployment. UNESCO states that “for every one US dollar spent on education, as much as US$ 10 to US$ 15 can be generated in economic growth” (UNESCO 2012). This indicates that an improvement in the completion rate of upper secondary education would mean a decrease in the percentage of employed population below the international poverty line (SDG 1.1.1), reflecting the results of the analysis.
The Red List Index measures the conservation status of all species. Using this index, the statistical analysis identified a negative relationship between SDG 15.5.1 and SDG 1.1.1 on employed population below the international poverty line. In fact, a study looking at research linking biodiversity conservation to poverty alleviations found that the most important attribute of poverty alleviation was the abundance or extent of biodiversity (Roe and Geneletti 2016). This is because biodiversity loss is connected to the loss of ecosystem service provisioning. Whether people are employed or not, biodiversity conservation from the species status perspective impacts poor communities by limiting their access to available food, thus deepening their poverty. Many poor and malnourished communities depend on inland fisheries, that is, freshwater fisheries (McIntyre, Reidy Liermann and Revenga 2016), which is also explained by the negative relationship that suggests an increase in the Red List Index (which translates to a decrease in a species’ risk of extinction) might decrease employed population below the international poverty line (SDG 1.1.1).

b. SDG 8.5.2 sub-indicator on unemployment rate
SDG 8.5.2 conveys the percentage of unemployed persons in the labour force (all those of working age, usually aged 15 and above). Unemployment reflects the underutilization of a country’s labour supply as well as the inability of an economy to generate employment for those persons who want to work but do not or cannot, even though they are available for employment and actively seeking work (UNSD 2022a). Unemployment does not present equally across age and gender. Youth and women, among other groups, are more likely to be unemployed (ILO 2021).
The statistical analysis identified only negative relationships with state of the ecosystem indicators and socioeconomic and environmental factors. For the state of the ecosystem indicators, SDG 6.6.1 sub-indicators on lakes and rivers seasonal water area and reservoirs minimum and maximum water area showed a negative relationship with unemployment rate (SDG 8.5.2). There are two aspects of how water resources are linked to employment. The first aspect is the role of water resource availability in reducing unemployment while the second aspect is about the role of water resources as a sector in providing jobs. For instance, the World Water Development Report 2016 stated that people who have the least access to water and sanitation are usually the most likely to have poor access to health care and stable jobs, thus continuing the cycle of poverty (WWAP 2016). As presented in other sections in this chapter, water resources are necessary to all sectors of the economy, in particular to agriculture, industry and energy. More specifically, water is an essential resource in many industries, and its availability, along with the efficiency of its use, impacts the growth of sectors. This is directly linked to job creation in the economy. It is estimated that three out of four jobs globally depend on water (WWAP 2016). The second aspect of the role of water resources as a sector in providing jobs is presented in the section on employed population below the international poverty line (SDG 1.1.1).
The statistical analysis has also identified a negative relationship between manufacturing value added as a proportion of GDP (SDG 9.2.1) and unemployment rate (SDG 8.5.2). A study in the West Kalimantan Province of Indonesia has identified a positive relationship between manufacturing value added and employment.
Figure 4.6 General model for unemployment rate, global level
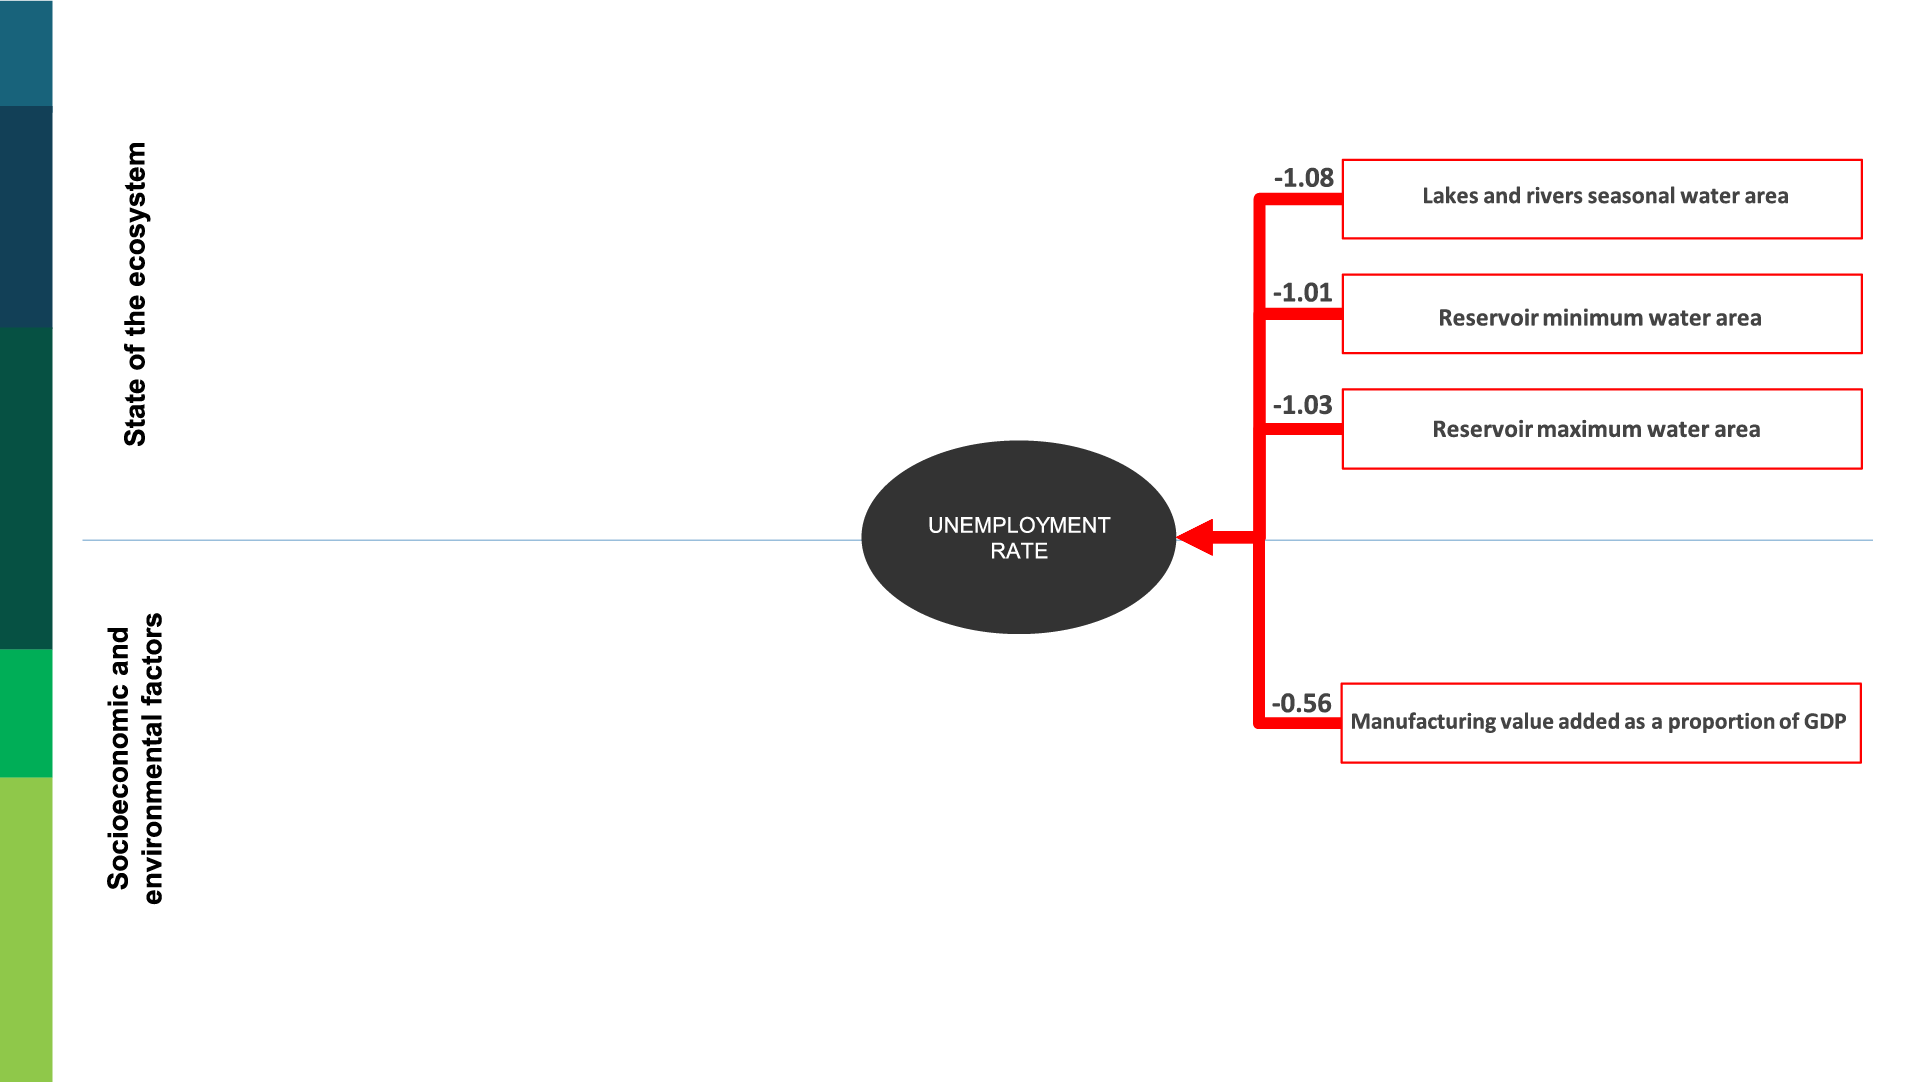
The study shows that the higher the value added, the more the manufacturing industries will absorb a proportion of the workforce (Jamaliah 2016). In addition, improvement in manufacturing value added will interest investment, increasing the demand for the goods and services industry. The more the role of manufacturing value added per GDP is reduced, the more significant the role of manufacturing in countries’ national economic development becomes (UNSD 2022a). An increase in manufacturing value added as a proportion of GDP (SDG 9.2.1) would lead to a decrease in unemployment rate (SDG 8.5.2), as presented in the results of the statistical analysis.

c. SDGs on malnutrition and undernourishment
An essential macronutrient, water plays a fundamental part in many physiological and metabolic processes. In children, these processes are particularly complex as thirst and thermoregulation develop. For children, the percentage of body water content decreases significantly in the first 2 years of life, from approximately 75 per cent at birth to 55 per cent around puberty.
Not only do the quantity and quality of what is drunk affect health in later life, but also the accessibility of the water itself, as regular hydration alongside nutrition undergirds a healthy and balanced diet. It has recently been shown for the first time that by increasing water intake over a four-day period to 2.5 litres a day significantly improves cognitive flexibility compared with low water intake (0.5 litres a day) in children (Khan et al. 2019). Safe accessible water can also support the growth and development of nutritious foods which in turn can optimize the health of a population.
The health of ecosystems, their quality and integrated management of water resources are closely intertwined with nutritional changes in the population. Access to adequate water sanitation in low- and middle-income countries has been pivotal in reducing infectious diseases among children and in improving food choices. These actions have led to a reduction in the prevalence of diarrhoeal diseases and have helped reduce the prevalence of undernutrition in children. Despite this progress, malnutrition remains a public health challenge across low- and middle-income countries, where overweight and obesity continue to grow, and the reduction of stunting and wasting is slow.
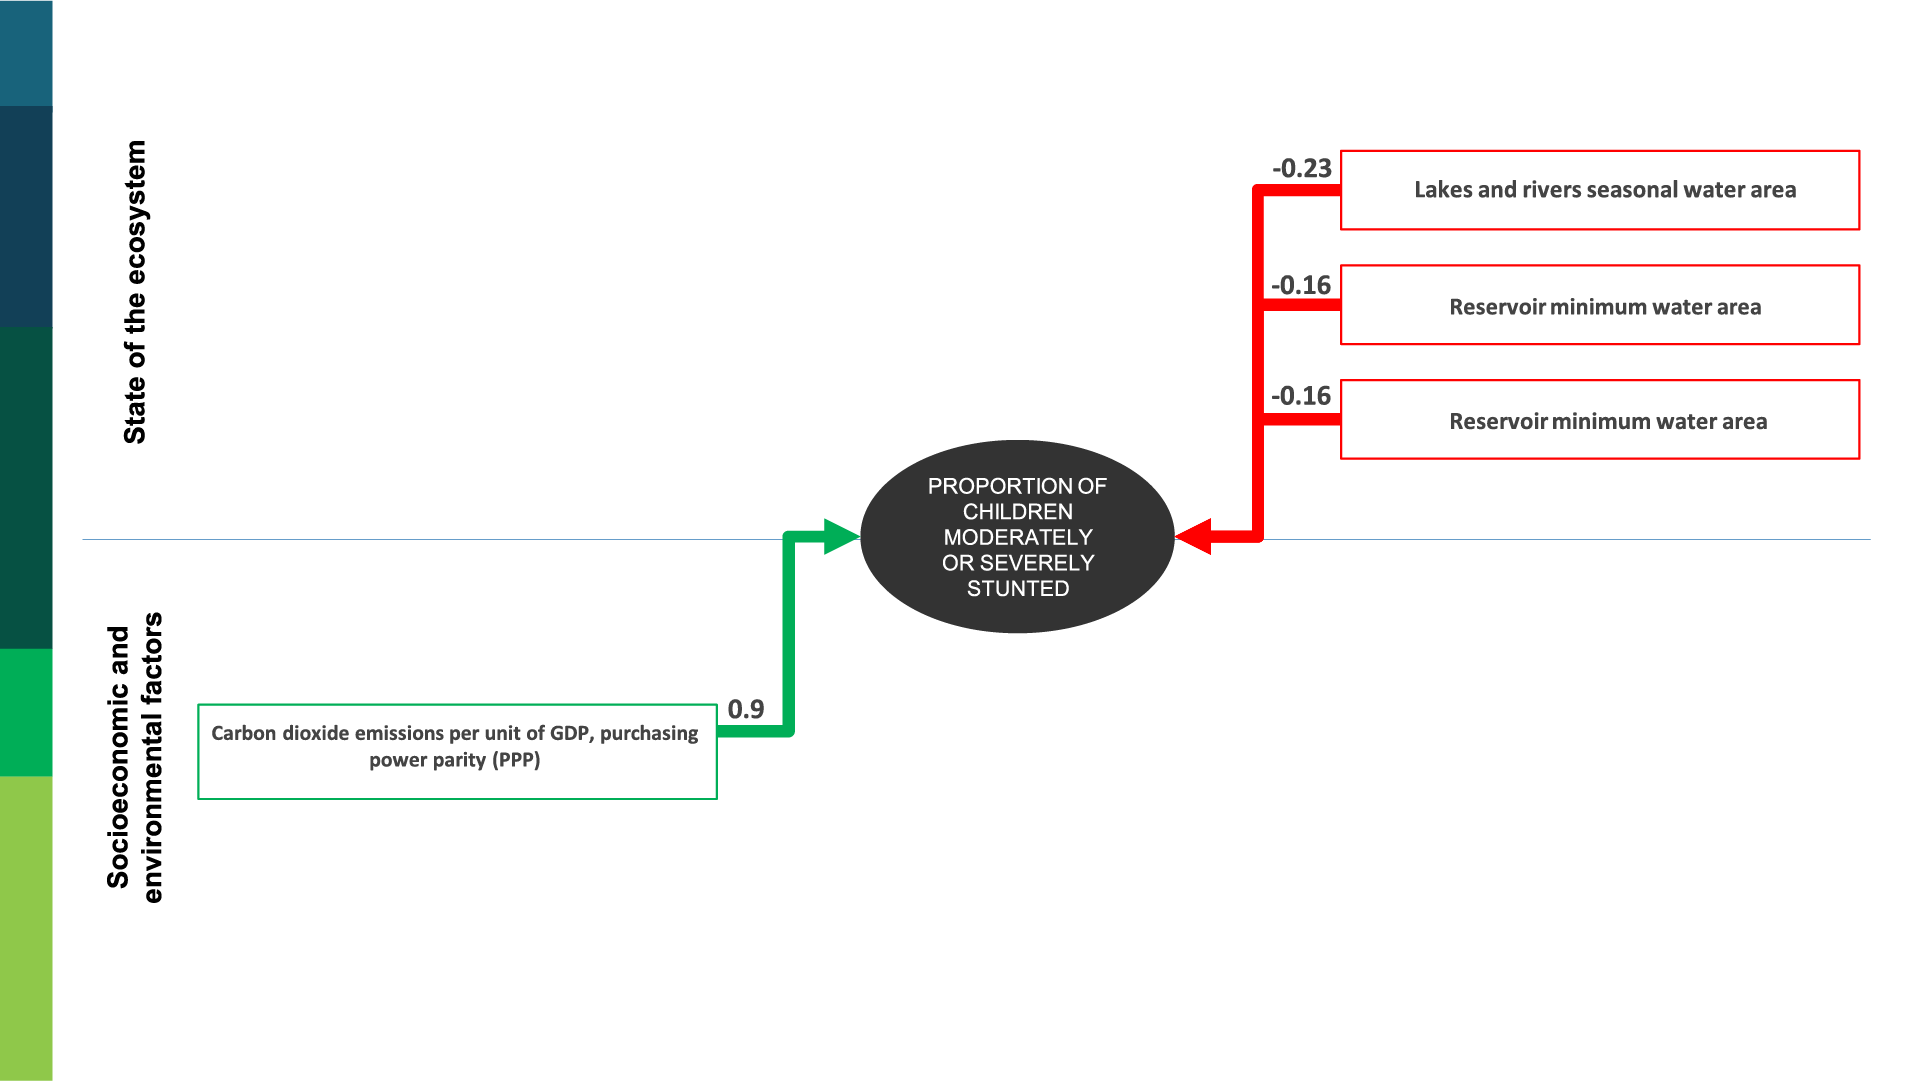
In this context, three indicators are used in the following section to better understand the impact of water resources availability (SDG 6.6.1) and undernourishment and malnutrition. SDG 2.1.1 defines undernourishment as “the condition by which a person has access, on a regular basis, to the amount of food that are insufficient to provide the energy required for conducting a normal, healthy and active life, given his or her own dietary energy requirements” (UNSD 2022b). The SDG 2.2.1 and 2.2.2 malnutrition indicators on children stunting (child is too short for their age) and on the prevalence of overweight (the child is too heavy for their height) are both pertinent, respectively, to undernutrition (WHO 2021) and children’s having too few calories for the amount of consumed food (UNSD 2022b).
As stunted and overweight are different forms of malnutrition (together known as the double burden of malnutrition), the interpretation of the statistical analysis results will be combined. The statistical analysis has identified negative relationships between SDG 6.6.1 on lakes, rivers and reservoirs water area and SDG 2.2.1 on the proportion of children moderately or severely stunted. Water resources, such as lakes, rivers and reservoirs play an essential role in agriculture and food production. The lack of water for crop irrigation or livestock feeding impacts the income of households and reduces their ability to purchase nutrient-dense food (Chase et al. 2019), leading to undernourishment. freshwater-related ecosystems have a particular impact on undernutrition and significant stunting, possibly due to mediation through proteinenergy malnutrition and micronutrient deficiencies arising from food production and nutrient quality in the food supply chain. On the other hand, freshwater resources house varieties of proteindense fish that can alleviate malnutrition problems (Phosa 2016). Therefore, increased lakes, rivers and reservoirs water area (SDG 6.6.1) could lead to a decrease in the proportion of children moderately or severely stunted (SDG 2.2.1).
In parallel, many low-income and middle-income countries’ dietary habits have changed where nutrient-deficient food has been replacing healthy food – specifically the cheap ultraprocessed food and beverages (Popkin, Corvalan and Grummer-Strwan 2020), which require a significant amount of water to be produced (Garzillo et al. 2022). Though this explains how overweight impacts water resources, it remains challenging to interpret how the increase in water resource availability may lead to an increase in the proportion of children moderately or severely overweight (SDG 2.2.2).
Figure 4.7 General model for the proportion of children moderately or severely overweight, global level
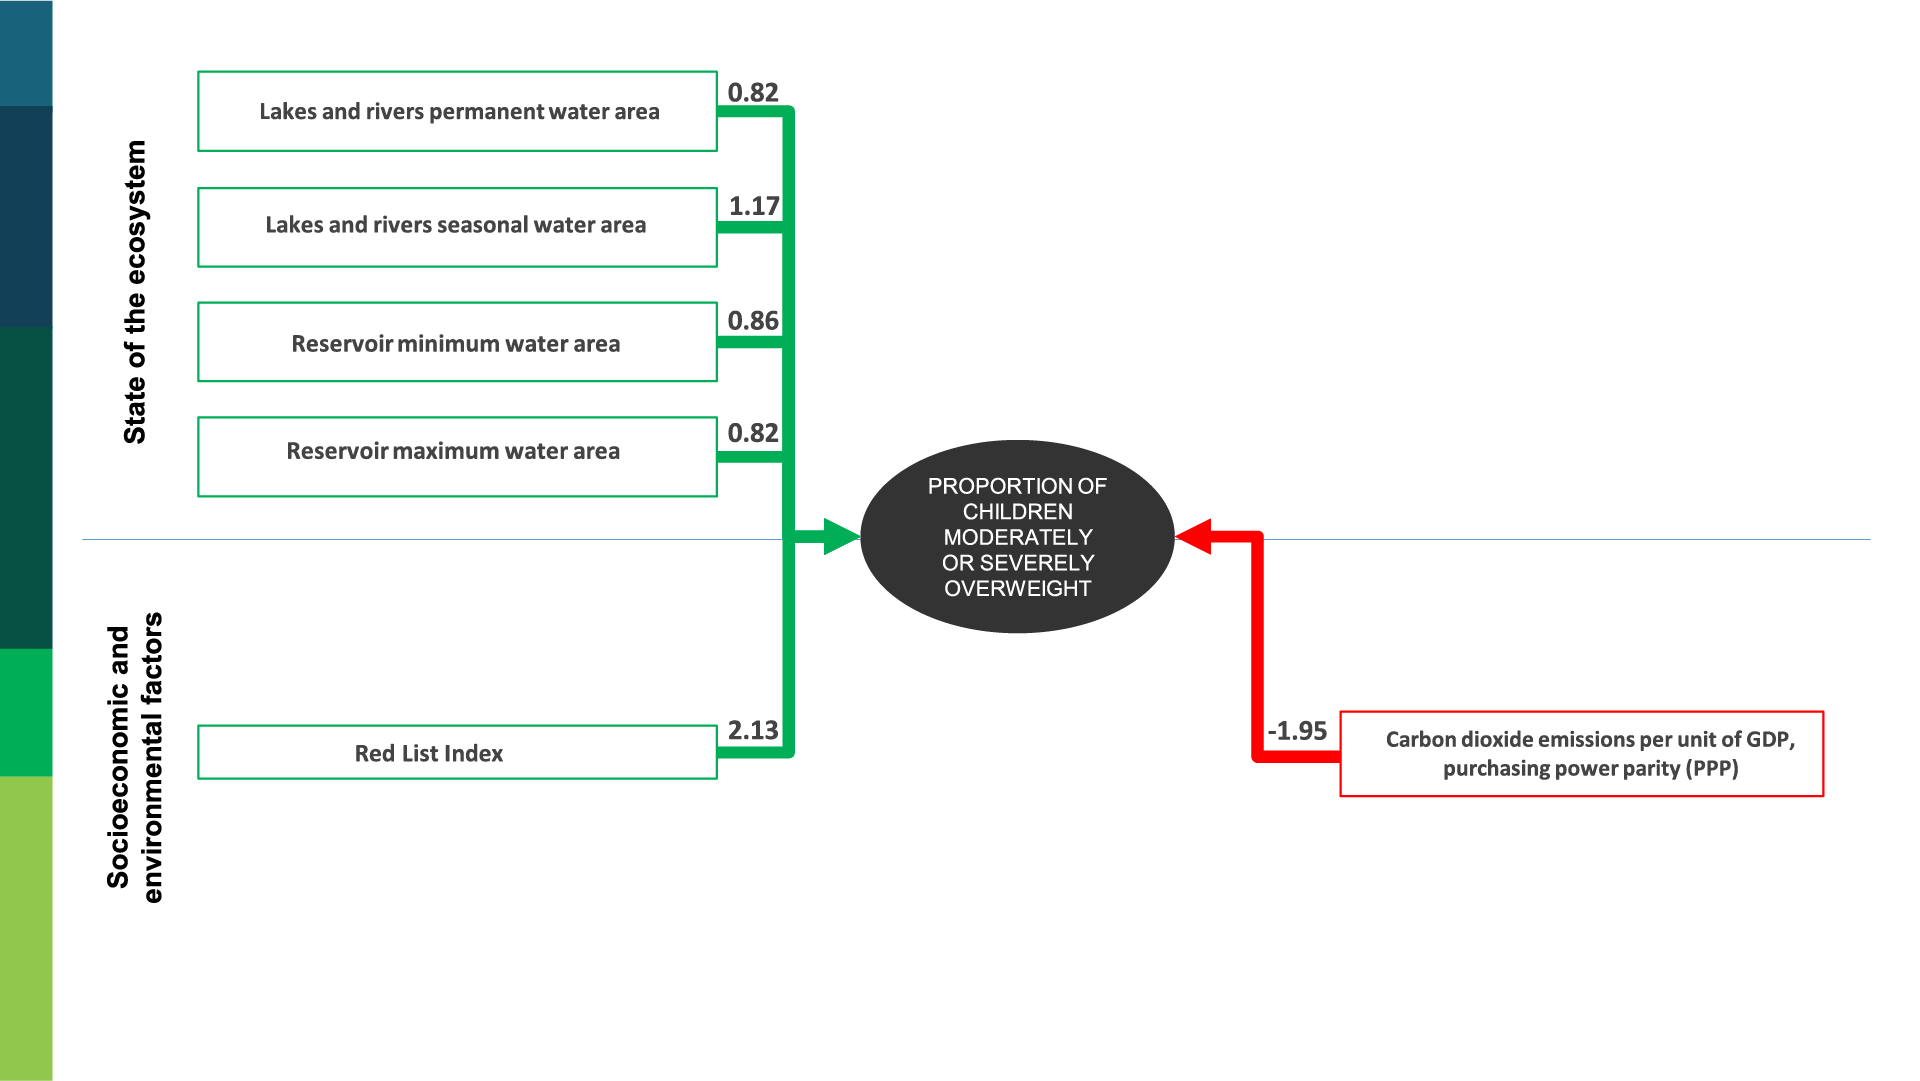
The direct exploitation of organisms has been categorized as the second main direct driver of species extinction (IPBES 2019). The human impact on species’ extinction threat level is accelerating. According to UNEP, “the loss of diverse diets is directly linked to diseased or health risk factors, such as diabetes, obesity and malnutrition” (UNEP 2019b). Hence, the more species that are at risk for extinction (SDG 15.5.1 on the Red List Index is increasing), the higher the proportion of children moderately or severely overweight (SDG 2.2.2), which reflects the strong positive relationship identified by the statistical analysis.
CO2 emissions per unit of GDP (SDG 9.4.1) is a factor that affects both stunting and wasting on one hand and overweight and obesity on the other. Much research has been done on the impact of increased CO2 emissions on agricultural production (Springmann et al. 2016), which reduces nutrients in agricultural products (Myers et al. 2014; Ebi and Ziska 2018) and leads to malnutrition. Although research is not extensive on the impact of CO2 intensity on malnutrition, it may be deduced that, with decreased CO2 emissions per unit of GDP (i.e. less CO2 required to produce one economic output), less pressure would be exerted on agricultural production. This is expected to be reflected in a decrease in the proportion of children moderately or severely stunted (SDG 2.2.1) and a decrease in the proportion of children moderately or severely overweight (SDG 2.2.2).
Figure 4.8 General model for the proportion of children moderately or severely stunted, global level
Undernourishment, as previously defined, focuses on the insufficient intake of food for maintaining a healthy and active life. The statistical analysis identified a negative relationship between the SDG 6.6.1 sub-indicators on lakes, rivers and reservoirs water area and on the prevalence of undernourishment (SDG 2.1.1). A study in India in 2019 revealed that maintaining or reducing water use while maintaining cereal production was possible, as the same water quantities were used between 2005 and 2014 and achieved an increase of 26 per cent in cereal production. By shifting cereal production to the dry season and enhancing maize, millet and sorghum production, India was able to maintain or reduce water use (Kayatz et al. 2019). Reducing water use in the agriculture sector helps increase water availability, in turn expanding lakes, rivers and reservoirs water area, while at the same time being able to produce more crops to feed populations and procure sufficient food intake to reduce undernourishment (Mughal and Sers 2020).
Figure 4.9 General model for prevalence of undernourishment, global level
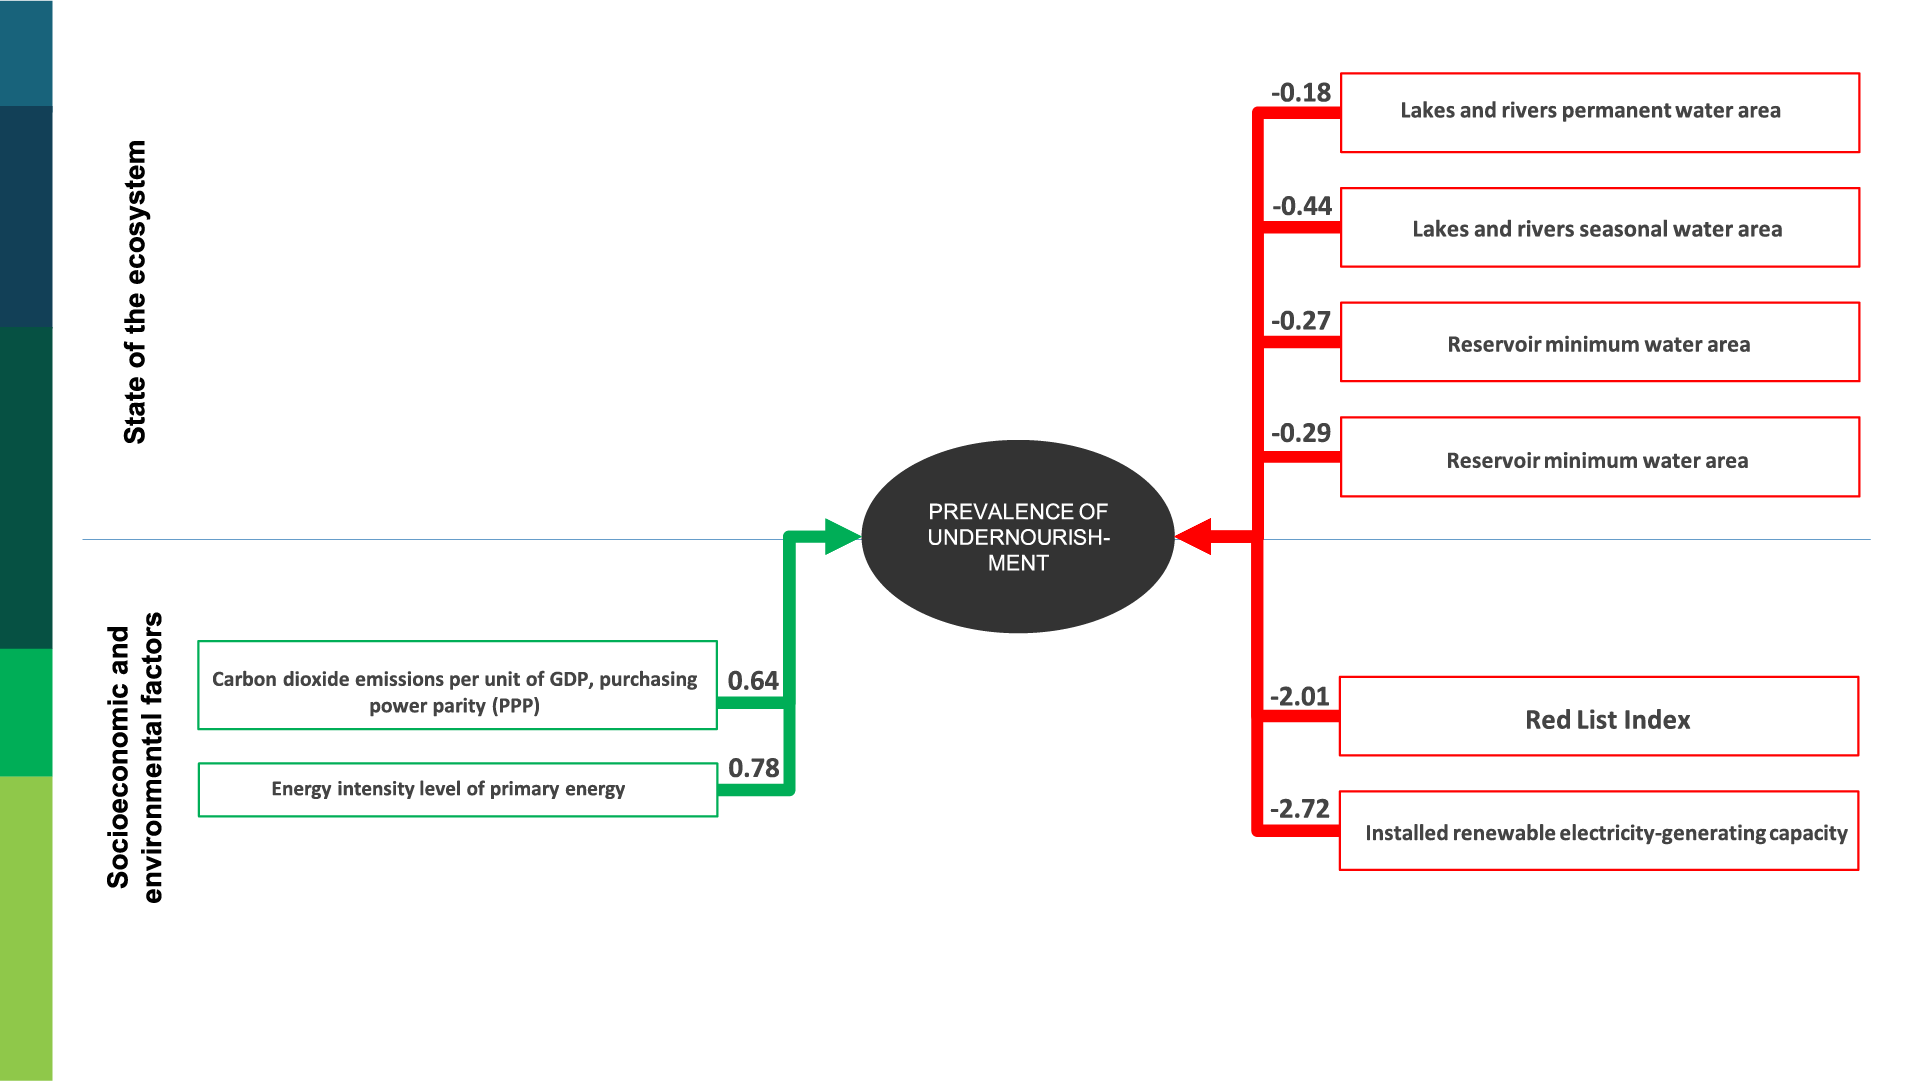
The statistical analysis identified a positive relationship between CO2 emissions per unit of GDP and the prevalence of undernourishment (SDG 2.1.1). Increased CO2 emissions were found to negatively impact livestock production systems through their impact on pasture and rangeland quality (biomass and nutritional quality) and quantity (Mbow et al. 2019). Therefore, an increase in CO2 emissions per unit of GDP (SDG 9.4.1) may imply an increase in the prevalence of undernourishment (SDG 2.1.1) (Mbow et al. 2019).
The statistical analysis identified a positive relationship between the energy intensity level of primary energy (SDG 7.3.1) and prevalence of undernourishment (SDG 2.1.1) as well as a negative relationship between installed renewable electricity-generating capacity (SDG 7.b.1) and prevalence of undernourishment (SDG 2.1.1). Electricity and energy are essential factors in the value chain of food production and utilization, which comprises production domains of different types of food, post-harvest processing, food storage and transformation, transport, distribution and preparation, among other processes (Candelise, Saccone and Vallino 2021).
More specifically, rural areas’ access to off-grid renewable energy technologies can lead to agricultural development through increasing productivity, efficiency and food products storage. The increased access to electricity (increasing the installed renewable electricity-generating capacity) leads to improved levels of food security and a decrease in prevalence of undernourishment (Candelise, Saccone and Vallino 2021). Moreover, carbon-intensive electricity production carries a negative impact on the prevalence of undernourishment (Raiten and Combs 2019; Shah, Dulal and Awojobi 2019). This can be interpreted as: the higher the energy intensity level of primary energy (SDG 7.3.1), the higher the prevalence of undernourishment (SDG 2.1.1).
As previously presented, the more species that are at risk of extinction, the more negative the impact on children’s nutrition and health becomes. The results of the statistical analysis reinforce this argument, as a decrease in the risk of species going extinct may cause a decrease in the prevalence of undernourishment (SDG 2.1.1).
d. Conclusion
-
Malnutrition and undernourishment were shown to be strongly impacted by SDG 7.b.1 on installed renewable electricitygenerating capacity and by SDG 9.4.1 on CO2 emissions per unit of GDP, and less strongly by water resources. As these indicators impact the provision, quality, access, storage and utilization of food products, they exert significant impact on malnutrition and undernourishment. Therefore, targeted policies that consider these indicators could play an essential role in reducing malnutrition and undernourishment.
-
Employed population below the international poverty line (SDG 1.1.1) was strongly impacted by completion rate of upper secondary education (SDG 4.1.2) and CO2 emissions per unit of GDP (SDG 9.4.1). The first indicator focuses on improved education, showing no uncertainty about the impact that improved education has on financial status and livelihood. With mounting evidence of the impact of CO2 emissions on people’s health, limiting or reducing CO2 emissions requires financial and emissions policies to call for more efficient and stricter regulation in countries’ economic sectors.
-
Unemployment rate (SDG 8.5.2) was found to be negatively impacted by lakes, rivers and reservoirs water area (SDG 6.6.1). As most jobs are found in water-intensive sectors, be they energy production, manufacturing or agriculture, and due to the limited water resources that are available on the planet, these sectors are focusing on exploring new technologies that are less water intensive. Hence, appropriate policies that encourage sectors to be less water dependent (financial incentives or taxation), yet simultaneously have in place regulatory systems to limit the use of water in these sectors, could be impacting jobs and water resources positively.
4.2 Interlinkages analysis of freshwater-related indicators at national level
4.2.1 Colombia
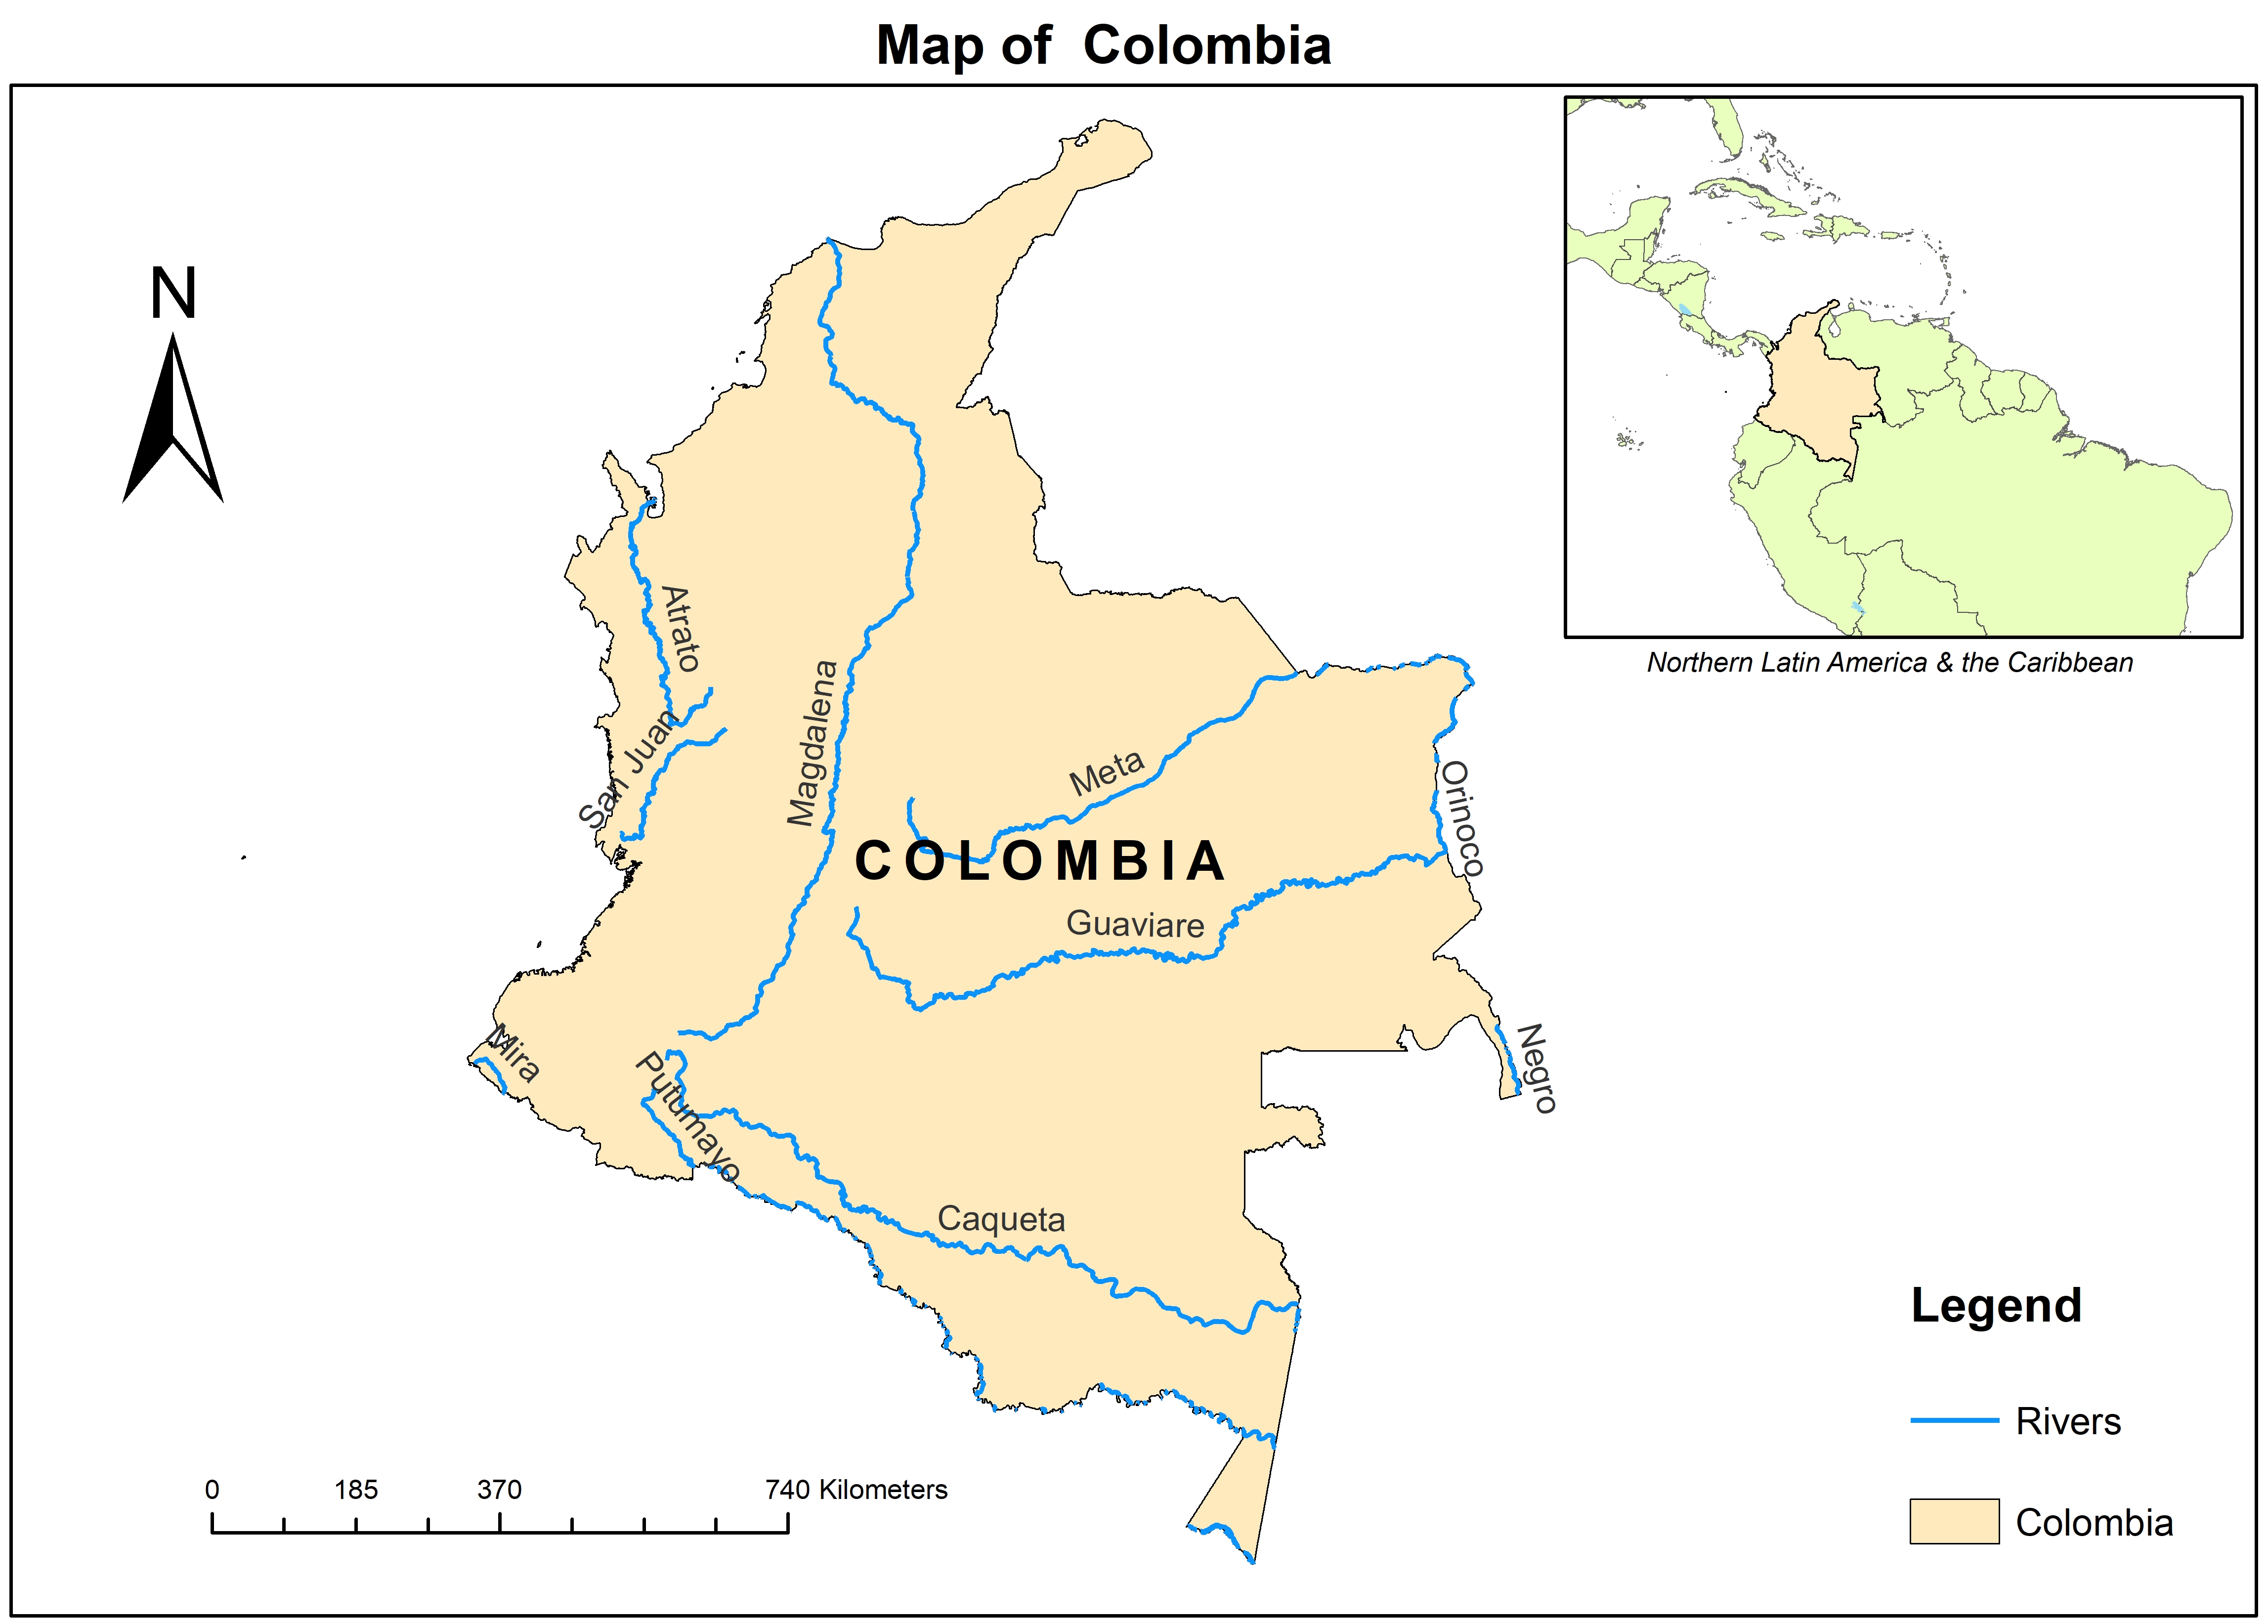
Map 4.1 Official map of Colombia (United Nations, 2022)
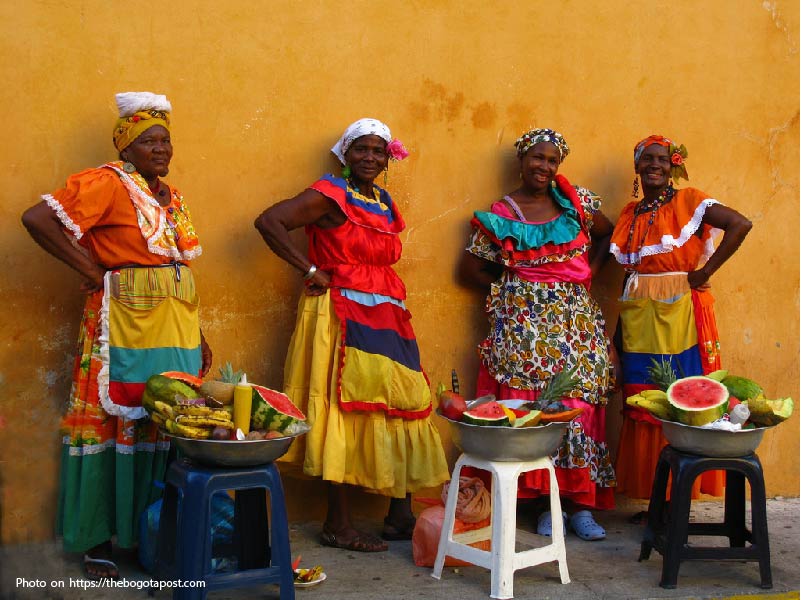
Access to safely managed drinking water (i.e. water from improved sources that are accessible on premises, available when needed and free from faecal and chemical contamination) has slowly been increasing in Colombia. Improved water sources include piped water, boreholes or tube wells, protected dug wells, protected springs, rainwater and packaged or delivered water. As of 2020, approximately 73 per cent of Colombia’s population have access to such water. Urban water supply coverage is still far more extensive (80 per cent of urban population) than rural water supply coverage (40 per cent of rural population), and even for many of those in rural areas with access to water supply, water quality is so low that the supply is not potable (WB 2020a). Women are often disproportionately impacted by environmental issues due to their social and economic vulnerabilities and having less access to economic resources, education and legal rights (UNEP 2020). For example, women in Colombia often rely on agriculture and fishing as sources of income, and environmental degradation can significantly impact these sectors.
4.2.1.1 Impact of drivers of change on the state of freshwater-related ecosystems
a. SDG 6.6.1 sub-indicators on lakes and rivers water area (permanent and seasonal)
The SDG 6.6.1 sub-indicators covering lakes and rivers water area, whether permanent or seasonal, are tested in this section to provide better insight from a national perspective on the relationship between drivers of change and socioeconomic and environmental factors. Based on Colombia’s data, lakes and rivers permanent water area increased from 2000 to 2013 and then decreased until 2019 to lower values than 2001 data. The lakes and rivers seasonal water area, however, show an increasing trend since 2000.
The following show a similarly increasing trend since 2000:
- SDG 1.4.1 on proportion of population using basic drinking water services
- SDG 6.1.1 on proportion of population using safely managed drinking water services
- SDG 15.1.2 on average proportion of freshwater KBAs covered by protected areas
- SDG 15.1.2 on average proportion of terrestrial KBAs covered by protected areas
- SDG 15.4.1 on average proportion of mountain KBAs covered by protected areas
- SDG 6.4.2 on level of water stress (freshwater withdrawal as a proportion of available freshwater resources) and GNI per capita
In comparison with the statistical analysis results obtained in the global section, SDG indicators 15.1.2 and 15.4.1 on the average proportion of terrestrial KBAs and mountain KBAs, respectively, show a strong positive relationship with lakes and rivers permanent and seasonal water area (SDG 6.6.1). Terrestrial KBAs and mountain KBAs play an important role in the conservation and maintenance of their respective ecosystems, which promotes the function of water conservation in the headwaters of rivers and lakes as well as the stability and continuous expansion of the permanent water area of rivers and lakes (Anselm, Brokamp and Schutt 2018; Rodriguez, Armenteras and Retana 2015; Ruiz Toro et al. 2020). On the other hand, the SDG 15.2.1 sub-indicator on average proportion of freshwater KBAs covered by protected areas only shows a strong positive relationship with lakes and rivers seasonal water area (SDG 6.6.1), and a non-statistically significant relationship with lakes and rivers permanent water area (SDG 6.6.1).
The statistical analysis has shown a strong negative relationship between SDG 6.4.2 on water stress and lakes and rivers permanent water area (SDG 6.6.1). It is certain that an increase in water stress, which represents the proportion of withdrawal of available freshwater resources, will lead to a decrease in lakes and rivers water area, as the extracted water comes from these resources, which can be seen in the decreased water area. Because of Colombia's fast economic growth, there are significant plans for agro-industrial expansion, which may seriously affect water availability (Pimentel, Prada and Walschburger 2021). In contrast to water stress, SDG 6.4.1 on water-use efficiency has shown to have a strong positive relationship with lakes and rivers permanent water area (SDG 6.6.1). Using the International Standard Industrial Classification (ISIC) of All Economic Activities, the indicator measures the unit of economic output for each cubic metre of water at three sectoral levels: (a) agriculture (ISIC A), (b) industry including power production (ISIC B, C, D and F) and (c) services (ISIC E and ISIC G–T), meaning that the higher the water-use efficiency of any sector, the less water is required to generate the same economic output. This decreases the need to withdraw water from permanent lakes and rivers to supply the sectors, which leads to an increase in lakes and rivers permanent water area (SDG 6.6.1), and vice versa.
Figure 4.10 General model for lakes and rivers permanent water area, Colombia
While the evidence in the global section shows a negative relationship between GNI per capita and lakes and rivers permanent water area (SDG 6.6.1), Colombia sees a positive relationship. Although an increase in GNI per capita would generally lead to an increase in water consumption and extraction, this can differ in a territory where vast water resources are available and population is sparse, as with Colombia.
The increase in manufacturing value added as a percentage of GDP (SDG 9.2.1) refers to the expansion of the manufacturing sector as part of the economy. The more this sector expands, the more natural and other resources are needed. Unless an increase in manufacturing value added as a proportion of GDP (SDG 9.2.1) is based on environmentally sound practices (that lead to the expansion of the manufacturing sector), its relationship with lakes and reservoirs permanent water area (SDG 6.6.1) is expected to be negative.
As discussed in the global section, the relationship between proportion of population using basic drinking water services (SDG 1.4.1) and lakes and rivers seasonal water area (SDG 6.6.1) is expected to be negative, as the allocation of more water to the population will lead to a decrease in water area. This is the case in Colombia, where its data inform that the proportion of population using basic drinking water services has been constantly increasing since 2000.
Figure 4.11 General model for lakes and rivers seasonal water area, Colombia
b. SDG 6.6.1 sub-indicators on reservoirs water area (minimum and maximum)
The statistical analysis has identified a positive relationship between the renewable energy share in the total final energy consumption (SDG 7.2.1) and reservoir minimum and maximum water area (SDG 6.6.1). Colombia’s energy mix had renewables at almost 23 per cent in 2019. Of that 23 per cent, around 11 per cent originated from hydropower electricity. More water storage is needed to operate upstream hydroelectric power plants, which increases the reservoirs water area (He et al. 2019).
As presented in the lakes and rivers section, the increase in renewable energy capacities and generation is beneficial for water resources, which explains the positive relationship with reservoirs minimum and maximum water area. In addition, the negative relationship between SDG 7.3.1 on energy intensity level of primary energy and SDG 6.6.1 on reservoirs minimum and maximum water area results from the less water required when energy intensity is improved (lower energy requirement to produce one unit of output), especially for energy sources such as fossil fuels and nuclear energy (Sarkodie and Owusu 2020; D'Odorico et al. 2018; Scanlon et al. 2017).
As presented in the section on lakes and rivers, indicators related to preservation of the surrounding environment of water resources play an important role in water conservation. This is also confirmed by the positive relationship between the average proportion of freshwater KBAs covered (SDG 15.1.2) and average proportion of mountain KBAs covered (SDG 15.4.1) with reservoir minimum water area (SDG 6.6.1).
The statistical analysis identified strong positive relationships between (a) urban population as percentage of total population, (b) proportion of population using basic drinking water services (SDG 1.4.1) and (c) water-use efficiency (SDG 6.4.1) and reservoir minimum water area (SDG 6.6.1). As more people move to cities (increase of urban population as percentage of total population), the water service providers of those cities will become more efficient in water delivery, for example by reducing water loss in networks (Campuzano Ochoa et al. 2015; Mahjabin et al. 2018). This would lead to a higher proportion of population using basic drinking water services and increased water-use efficiency in the residential sector as well as contribute to the consumption of fewer water resources, including reservoirs water area (SDG 6.6.1).
Figure 4.12 General model for reservoirs maximum water area, Colombia
As presented in Colombia’s lakes and rivers water area section, its level of water stress carries a negative impact on water resources. From this it can be concluded that a higher level of water stress coincides with fewer water resources available and quantities that can be stored (e.g. reservoirs) and vice versa (Weber et al. 2017).
The statistical analysis has identified a negative relationship between domestic material consumption per unit of GDP (SDG 8.4.2/12.2.2) and reservoir minimum water area (SDG 6.6.1). The higher the domestic material consumption per unit of GDP is, the less efficient processes become, requiring more water.
Figure 4.13 General model for reservoir minimum water area, Colombia
The statistical analysis shows a positive relationship between manufacturing value added as a proportion of GDP (SDG 9.2.1) and reservoir minimum water area (SDG 6.6.1). As presented in the global section, the increase of manufacturing value added as a proportion of GDP, coupled with environmentally sound practices to support the expansion of the sector might require fewer natural resources. In Colombia in 2021, the agribusiness sector represented 7.4 per cent of the value added as proportion of GDP (UNSD 2022c). In response to climate change in the country, ecosystem-based adaptation methods in the agriculture sector – coupled with political will and policy coherence – are improving the resilience to vulnerable farmer communities (WRI 2022). On the other hand, the negative relationship between CO2 emissions per unit of GDP (SDG 9.4.1) and reservoirs water area (SDG 6.6.1) is driven by improved efficiencies, as presented in the global section.
c. Conclusion
-
Colombia’s analysis has shown a strong positive relationship between biodiversity conservation and water resources. Being the second-most biodiverse country on Earth, the Colombian Government developed the Biodiversity Action Plan (2016–2030) to implement the National Policy for the Integral Management of Biodiversity and its Ecosystem Services. This action plan to conserve biodiversity is aligned with the national policy for the integrated management of water resources, among other national policies that centre the conservation of biodiversity and threatened species and ecosystem restoration, among others (MESD 2017). These conservation efforts combined show the significance of such identified relationship to the national context.
-
In addition, water-use efficiency indicators show a strong positive relationship with water resources. In 2010, Colombia adopted its policy on integrated water resources management, which, in addition to water resource management, focuses on the efficiency of use and evidence-based decision-making, among other targets (OECD 2020). Water resource management in Colombia is community-based; water is a fundamental human right there, and legal instruments are in place to ensure community participation in management and decision-making (Fromherz and Lyman 2021). The strongest negative relationship was identified between the level of water stress and water resources, which is expected to be monitored closely due to the country’s agro-industrial expansion.
4.2.1.2 State of the freshwater-related ecosystems’ impact on the state of human well-being
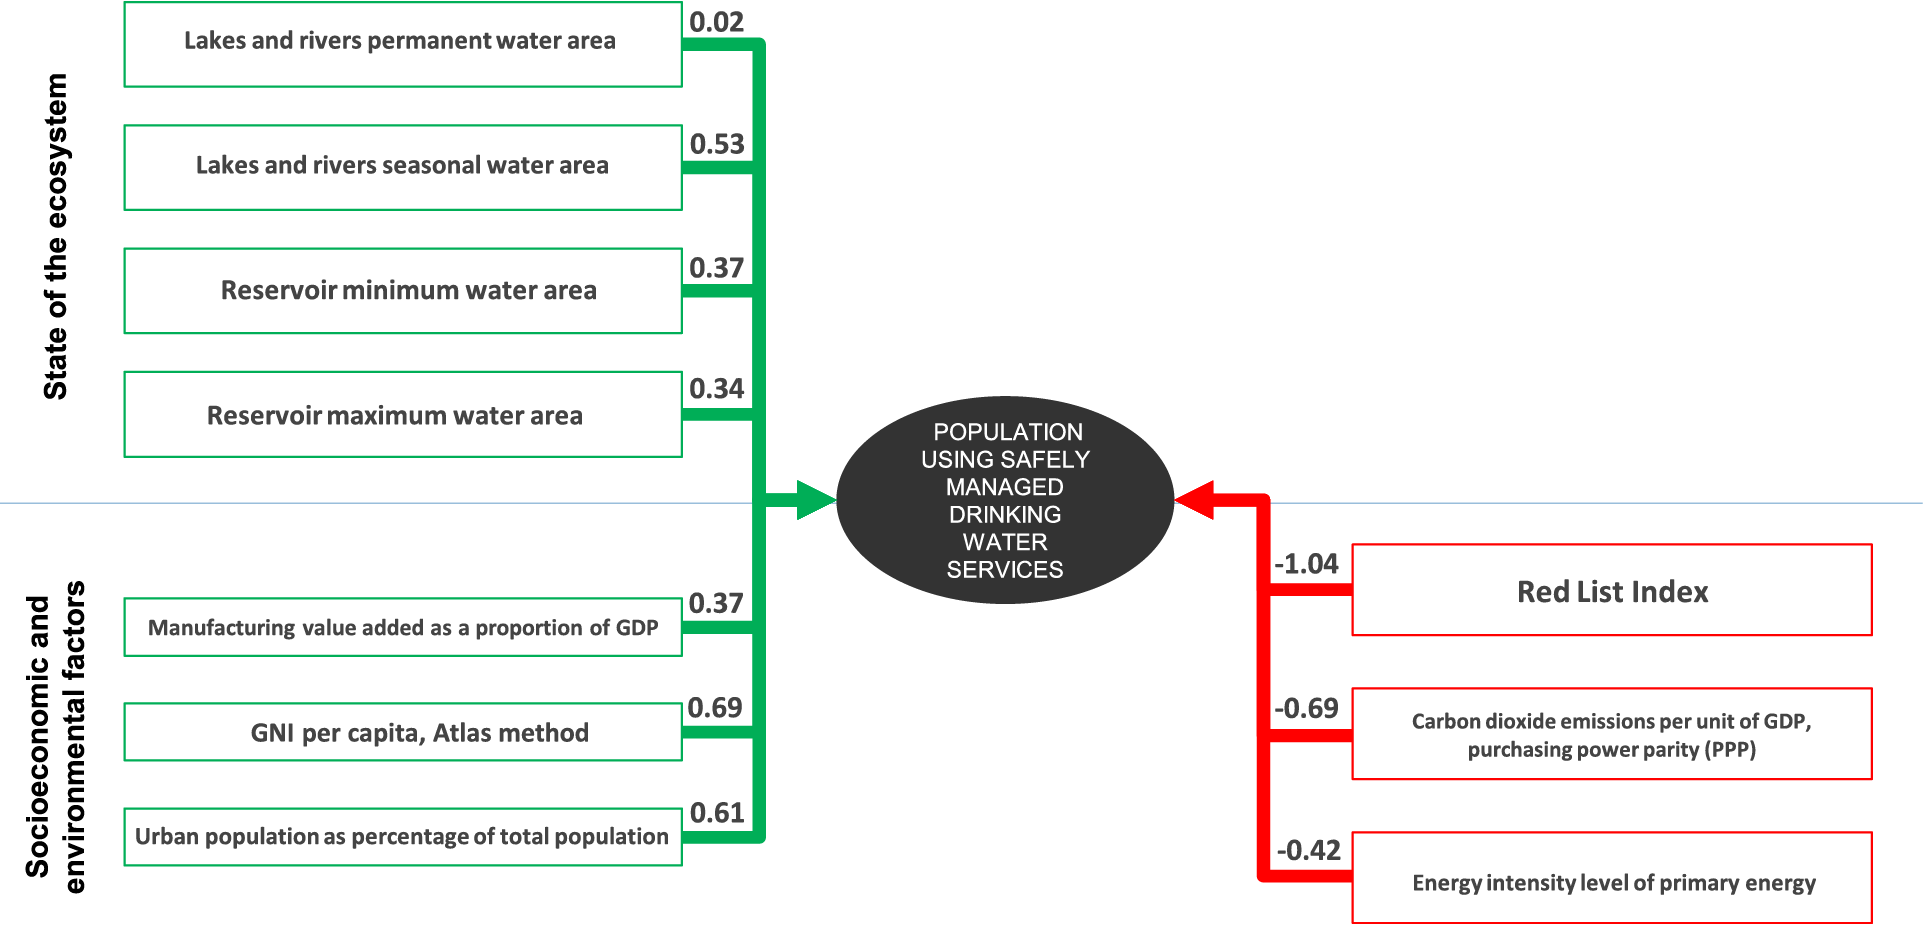
In this section, SDG 6.1.1 on proportion of population using safely managed drinking water services is considered as the dependent variable, hence the section will present the impact of the state of the ecosystem and socioeconomic and environmental factors on the proportion of population using safely managed drinking water services.
a. SDG 6.1.1 sub-indicator on proportion of population using safely managed drinking water services
The seasonal water area of freshwater lakes and rivers as well as that of reservoirs (SDG 6.6.1) has a positive relationship with the proportion of population using safely managed drinking water services (SDG 6.1.1). A 0.46 per cent increase in the proportion of population in Colombia using safely managed drinking water services is directly related to an increase of 1 per cent in the seasonal water area of lakes and rivers (SDG 6.6.1). Similarly, when reservoirs minimum and maximum water area (SDG 6.6.1) increase, so too does the proportion of population using safely managed drinking water services (SDG 6.1.1).
Colombia’s alpine wetlands, or páramos, provide essential ecosystem services in the regulation of the country’s hydrological cycle (OECD/ECLAC 2014; WB 2020a). They are also the source of major rivers in the country including the Cauca, the Magdalena and the Meta. Around 70 per cent of the Colombian population’s water supply originates from the páramos. For example, the páramos in the Chingaza National Park, Sumapaz Páramos and Cruz Verde supply water to Bogotá (OECD/ECLAC 2014). Payment by the Bogotá water utility to the Chingaza National Park helps to protect this habitat and secure most of the supply of good-quality drinking water to Bogotá, as well as some of the water supply for the country’s hydropower generation (OECD/ECLAC 2014). The Belmira páramo supplies water to Medellín, and the Santurbán páramo supplies water to Bucaramanga (OECD/ECLAC 2014). Mining operations and growing agricultural activities threaten much of the páramos, which Colombia’s population depends on for freshwater. A decrease in the area of these sensitive and unique freshwater ecosystems will carry significant implications for the future of drinking water services in Colombia (WB 2020a).
Around 24 per cent of Colombia’s freshwater-related ecosystems show transformations caused by urbanization, agriculture expansion, cattle ranching and infrastructure development (WWFColombia 2017). Future water yield will largely be determined by land usage and the impact of climate change. Data indicate that Colombia will be unable to sustain the hydrological functionality of watersheds without safeguarding forest, water and coastal ecosystems via the designation and effective management of key protected areas (Valenzuela 2022). This would not only protect biodiversity, but also support ecosystem services such as water provision and climate regulation, enhancing community well-being.
Figure 4.14 General model for population using safely managed drinking water services, Colombia
There is a positive relationship between GNI per capita and proportion of population using safely managed drinking water (SDG 6.1.1). As presented in the global section, an increase in national income per capita leads to improvements in people’s lifestyles and their abilities to afford and access improved water sources and services. Access to clean drinking water and sanitation reduces health risks and frees up time for education and other productive activities.
The statistical analysis implies a negative relationship between SDG 15.5.1 on the Red List Index and SDG 6.1.1 on the proportion of population using safely managed drinking water services. Such a relationship is challenging to interpret, because the proportion of population using safely managed drinking water services typically affects the extinction level of various species. The building of infrastructure and the withdrawal or diversion of water to attend to population needs for drinking water causes species to decrease. In addition, due to the expansion of illicit crops and mining activities, freshwater-related ecosystems have deteriorated, and species including game birds, predatory birds, parrots and large frugivores have become the most threatened in the high Andean Forest páramo (Renjifo, Amaya-Villarreal and Butchart 2020).
There is a significant negative relationship between CO2 emissions per unit of GDP (SDG 9.4.1) PPP and proportion of population using safely managed drinking water services (SDG 6.1.1). Lower CO2 emissions per unit of GDP PPP implies less CO2 emitted per unit of GDP. This relationship could result from Colombia’s heavy reliance on hydropower, which causes CO2 emissions from fuel combustion to be lower per unit of GDP (OECD/ECLAC 2014). Since drinking water supply requires energy, greater use of hydropower would ensure a lower level of CO2 emitted.
The share of the energy intensity from fossil fuels in Colombia is slowly decreasing. While this indicates improvement in energy efficiency, especially for the production of energy from fossil fuels, the water requirement to produce one unit of output is reduced, that is, less quantity of water used from lakes and rivers. This negative relationship is visible in Colombia.
b. Conclusion
-
With the páramos providing over 70 per cent of the drinking water in Colombia, their protection is essential. Land-use changes, specifically those caused by mining and illicit agriculture, are upsetting the delicate ecosystem services that the páramos provide. As water supply is intricately linked with the health of water-related ecosystems, it is essential that Colombia maintain a sustainable balance between the protection of ecologically importance water sheds and socioeconomic growth opportunities.
4.2.2 Mongolia
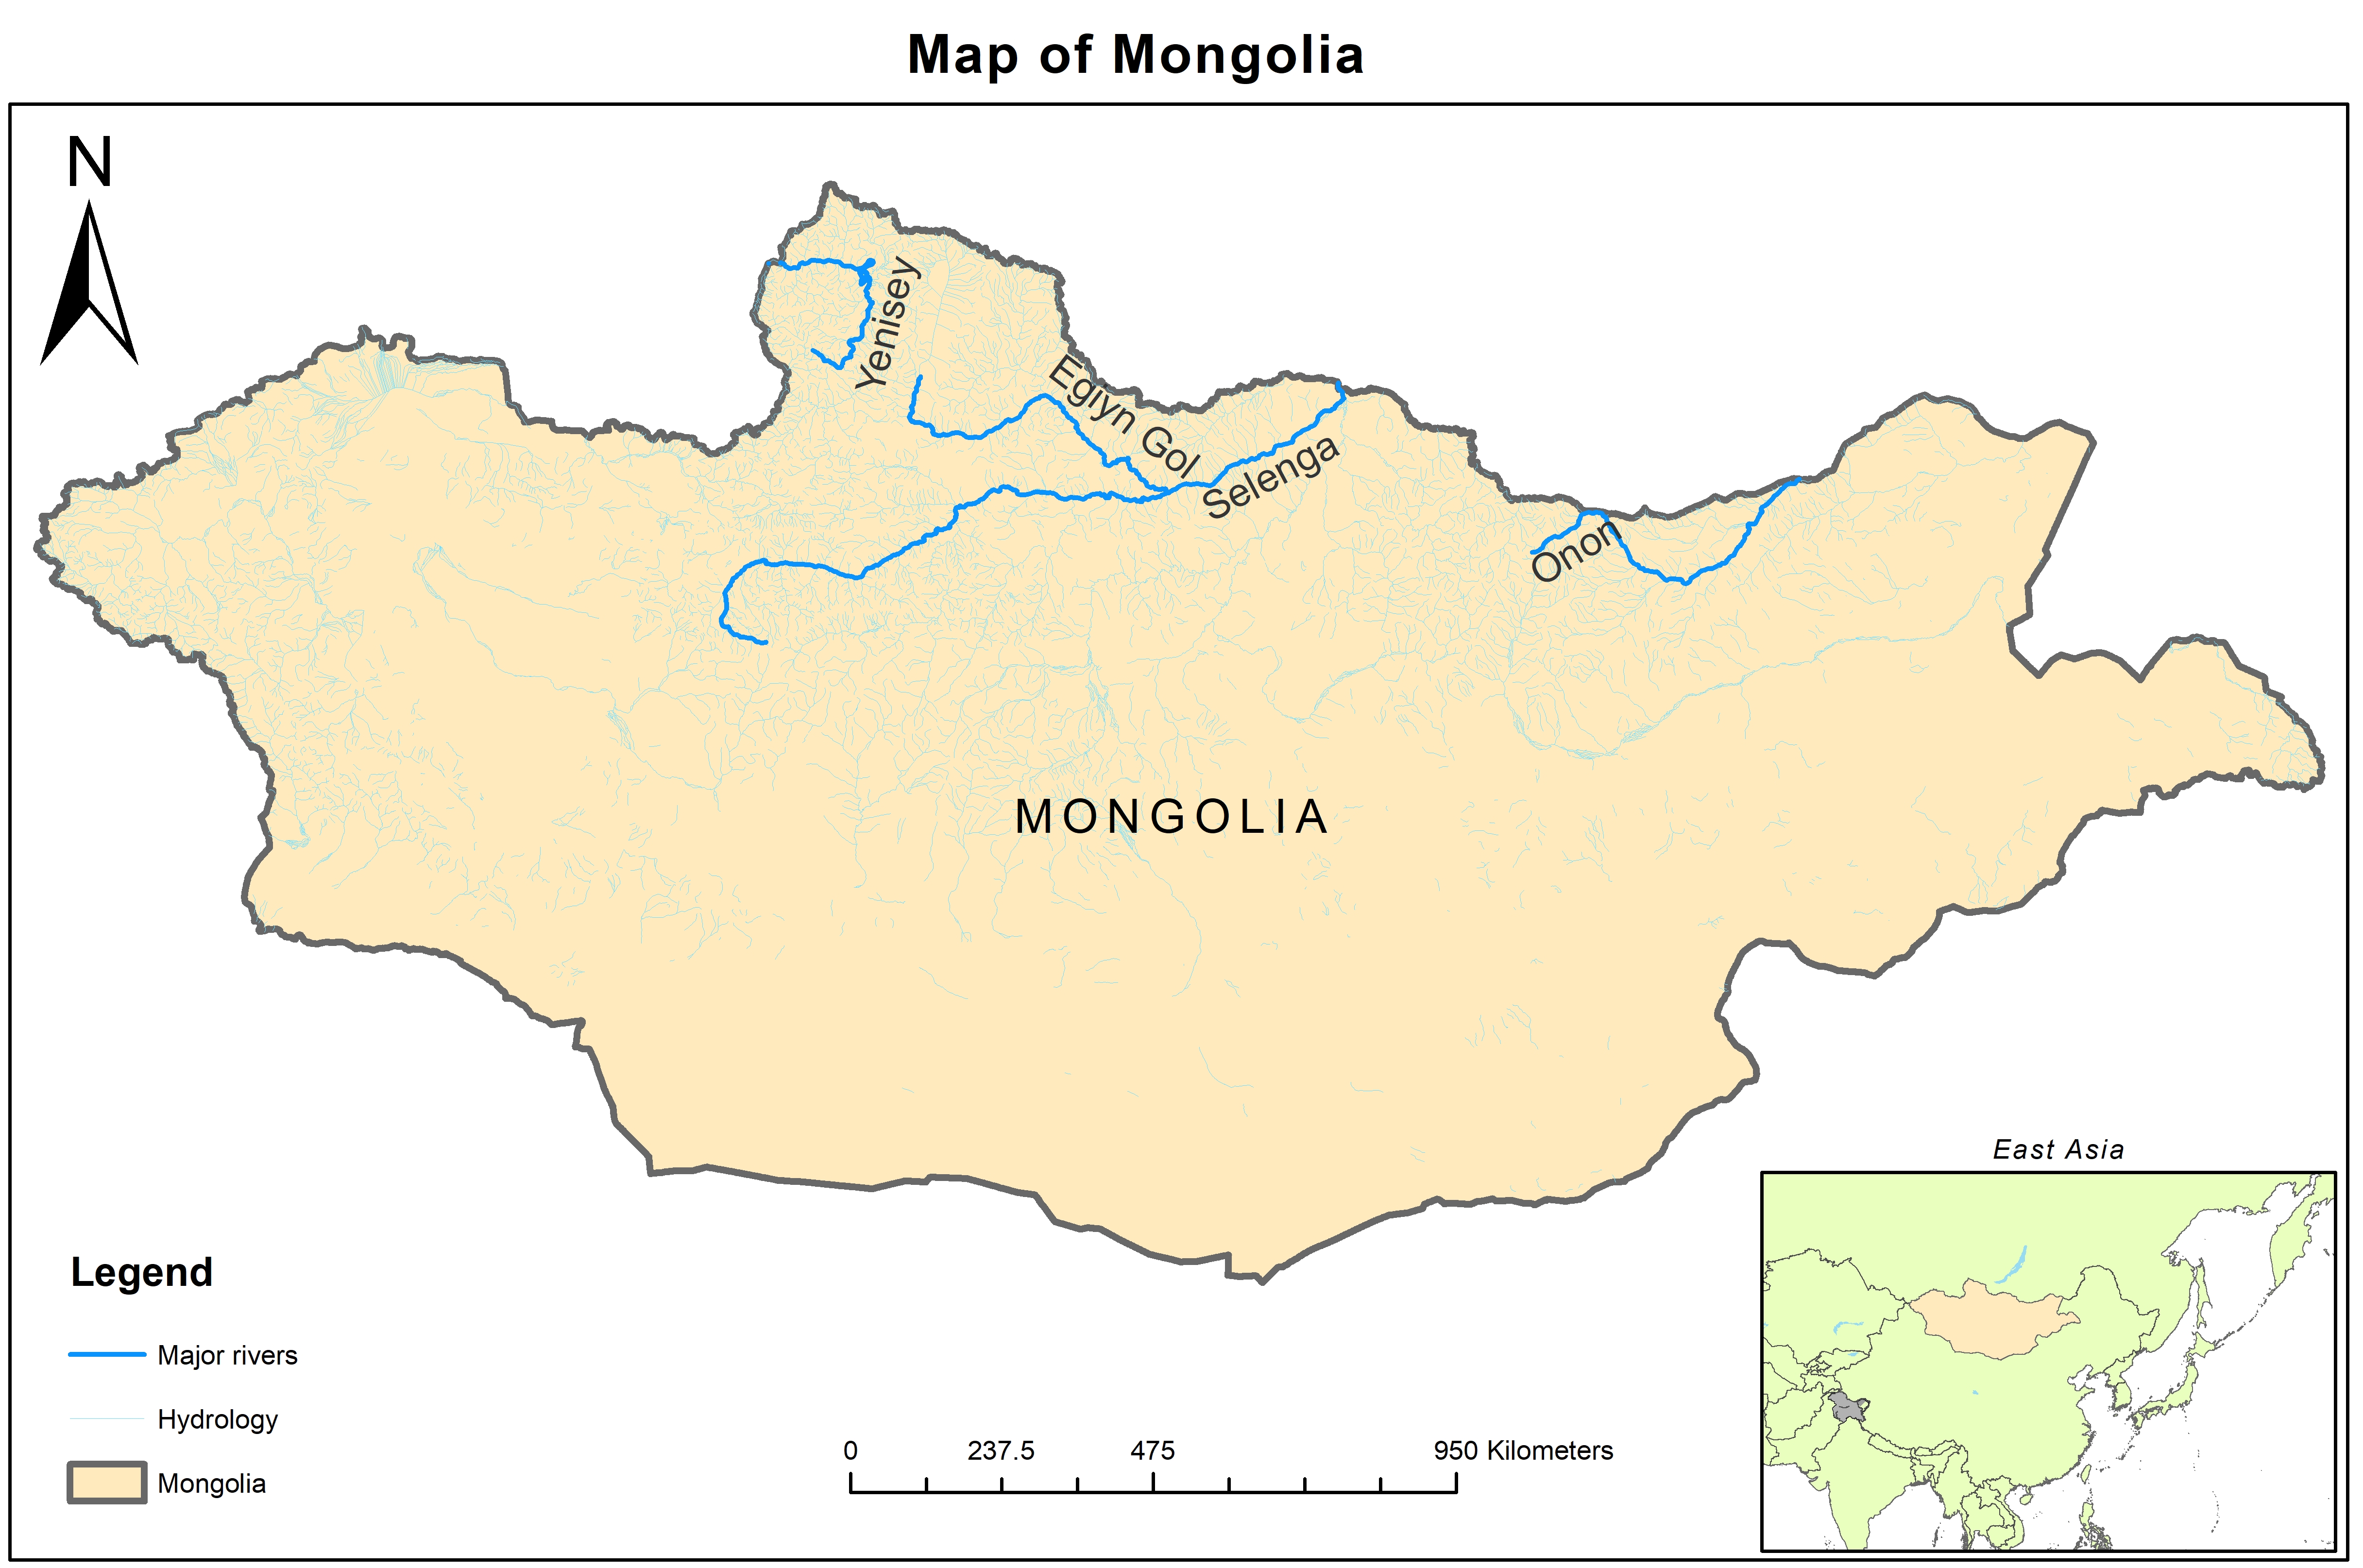
Map 4.2 Official map of Mongolia (United Nations, 2022)
The country’s population is unevenly distributed, with most living in the central and northern regions where socioeconomic activities are concentrated. The southern region, where large mining activities are carried out, is the least populated. The capital city Ulaanbaatar is home to almost half the country’s population. The rapidly intensifying effects of climate change are having a profound impact on the lives of people in Mongolia, especially girls and women, as they often rely on pastoralism and agriculture as sources of income (UN WOMEN 2022b).
Although Mongolia contains plentiful water resources, they are unevenly distributed across the land and seasons. Large freshwater lakes and major rivers are found in the northern and western regions of the country. The southern region, where arid and desert ecosystems dominate with little rainfall, relies mainly on groundwater resources for drinking water supplies, livestock and mining. In recent decades, freshwater-related ecosystems in Mongolia have experienced remarkable lake shrinkage due to intensifying human activity and climate change (Hasumi, Hongorzul and Terbish 2011; Liu et al. 2022; Shinneman et al. 2010; Yadamsuren et al. 2020). The endorheic lakes have also been threatened by both salinization and eutrophication (Tang et al. 2021), namely the Great Lakes region of western Mongolia. Encompassing a diversity of lake ecosystems, from alpine freshwater to lowland salt lakes, this region increasingly faces environmental threats from excessive grazing and climate change (Bouchard, Hayford and Ferrington 2022).
Mongolia has made progress in water and sanitation. Nonetheless, providing access to safe drinking water for the entire population remains a challenge. At the national level, 88 per cent of the total population in 2020 had access to improved drinking water sources, but only 30 per cent had access to safely managed drinking water (UN n.d.). Access to water and sanitation varies geographically and socially. Several programmes on adequate housing, implemented by the government since 2006 (SHC of Mongolia 2022), have resulted in the provision of access to safe drinking water for thousands of additional households in Ulaanbaatar and in provinces.
4.2.2.1 Impact of drivers of change on the state of freshwater-related ecosystems
a. SDG 6.6.1 sub-indicators on lakes and rivers water area (permanent and seasonal)
Between 2000 and 2019, SDG 6.6.1 sub-indicator on lakes and rivers permanent and seasonal water area show an increasing trend. Data for SDG 1.4.1 on proportion of population using basic drinking water services, SDG 6.4.1 on water-use efficiency, GNI per capita and urban population as percentage of total population have shown an increase since 2000. On the other hand, SDG 7.2.1 on renewable energy share in the total final energy consumption, SDG 7.3.1 on energy intensity level of primary energy, SDG 8.4.2/12.2.2 on domestic material consumption per unit of GDP, SDG 9.4.1 on CO2 emissions per unit of GDP and SDG 15.5.1 on Red List Index have exhibited a decreasing trend since 2000.
The statistical analysis reveals a positive relationship between SDG 6.6.1 sub-indicators on lakes and rivers permanent and seasonal water area and (a) SDG 1.4.1 on proportion of population using basic drinking water services, (b) urban population as percentage of total population. In Mongolia, 80 per cent of water supply originates from groundwater due to the cold climate that freezes surface-water area during winter (Dandar 2017). Moreover, the central and northern regions of the country are the most populated, making the reliance on groundwater for water supply imperative, as lakes and rivers permanent or seasonal water area would not receive significant pressure from the increase in urban population or the proportion of population using basic drinking water services. SDG 6.4.1 on water-use efficiency has shown to have a positive relationship with lakes and rivers permanent and seasonal water area (SDG 6.6.1). As this is an efficiency indicator of which data for Mongolia indicate improvement for agriculture and industry water efficiencies (FAO n.d.), which remain the two largest waterconsuming sectors in Mongolia, this may imply a positive impact on the water area of lakes and rivers, whether permanent or seasonal.
Figure 4.15 General model for lakes and rivers permanent water area, Mongolia
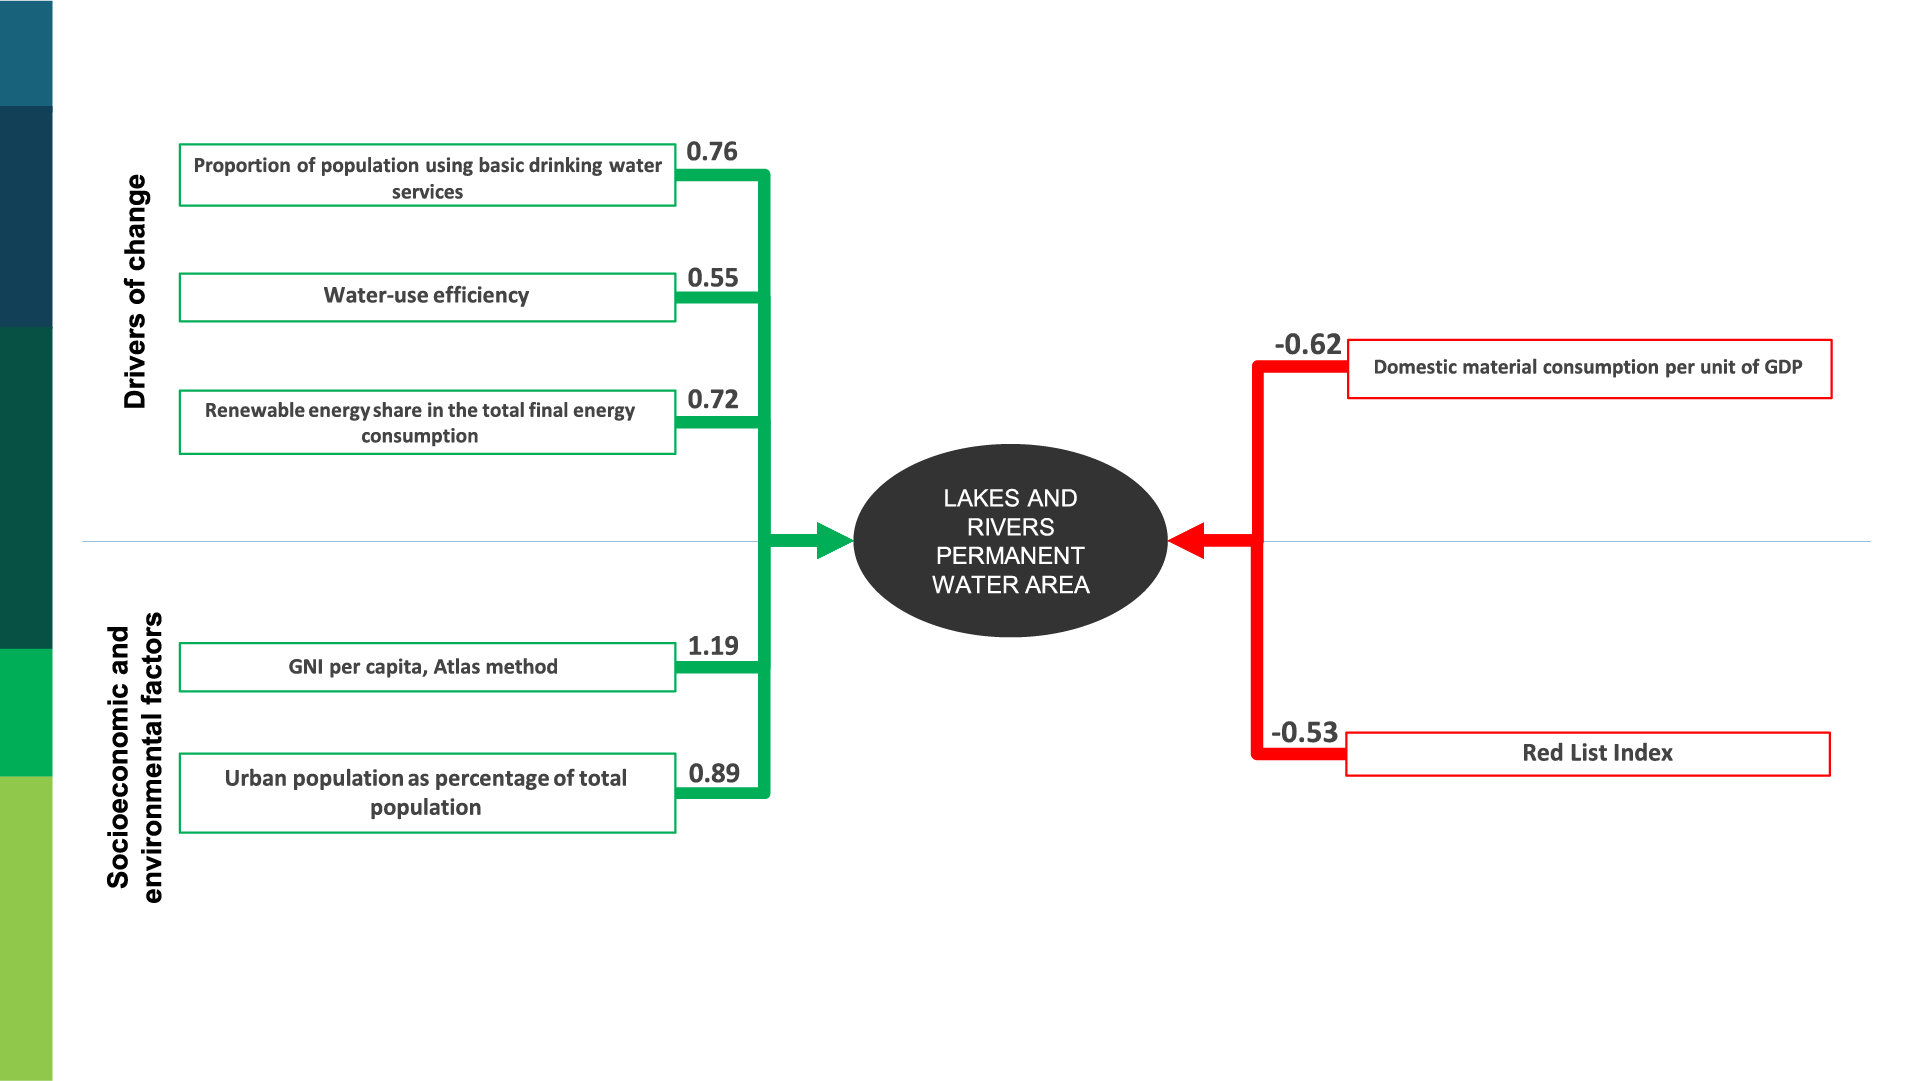
The statistical analysis has indicated a positive relationship between SDG 7.2.1 on renewable energy share in the total final energy consumption and lakes and rivers permanent and season water area (SDG 6.6.1). In Mongolia, most of the energy generated in the country is based on coal, given its richness in natural resources. The current and future decommissioning of some plants, the nation’s growing electricity demand and the high level of air pollution from coal energy production have led the Government of Mongolia to shift to renewable energies, against the backdrop of a 2.6 terra-watt potential for the country (IRENA 2016). The Government has committed to increasing the share of renewable energy nationwide to 30 per cent by 2030 by exploiting wind and solar energies in the Gobi Desert region (IRENA 2016). Given that coal energy production is extremely water intensive (Luo, Otto, Shiao and Maddocks 2014), the shift from energy produced by coal to wind and solar impacts positively lakes and rivers permanent and seasonal water area (SDG 6.6.1).
The statistical analysis indicates a negative relationship between SDG 8.4.2/12.2.2 on domestic material consumption per unit of GDP and SDG 6.6.1 sub-indicators on lakes and rivers permanent and seasonal water area. In Mongolia, domestic material consumption per unit of GDP has been decreasing for the same period, indicating that less material consumption is required to produce one unit of GDP (UNEP 2021c). Since the greater decrease in domestic material consumption per unit of GDP (SDG 8.4.2/12.2.2) is translated into the use of less water resources to consume materials, this reflects an increase in lakes and rivers water area (SDG 6.6.1), confirmed by the results of the statistical analysis.
Figure 4.16 General model for lakes and rivers seasonal water area, Mongolia
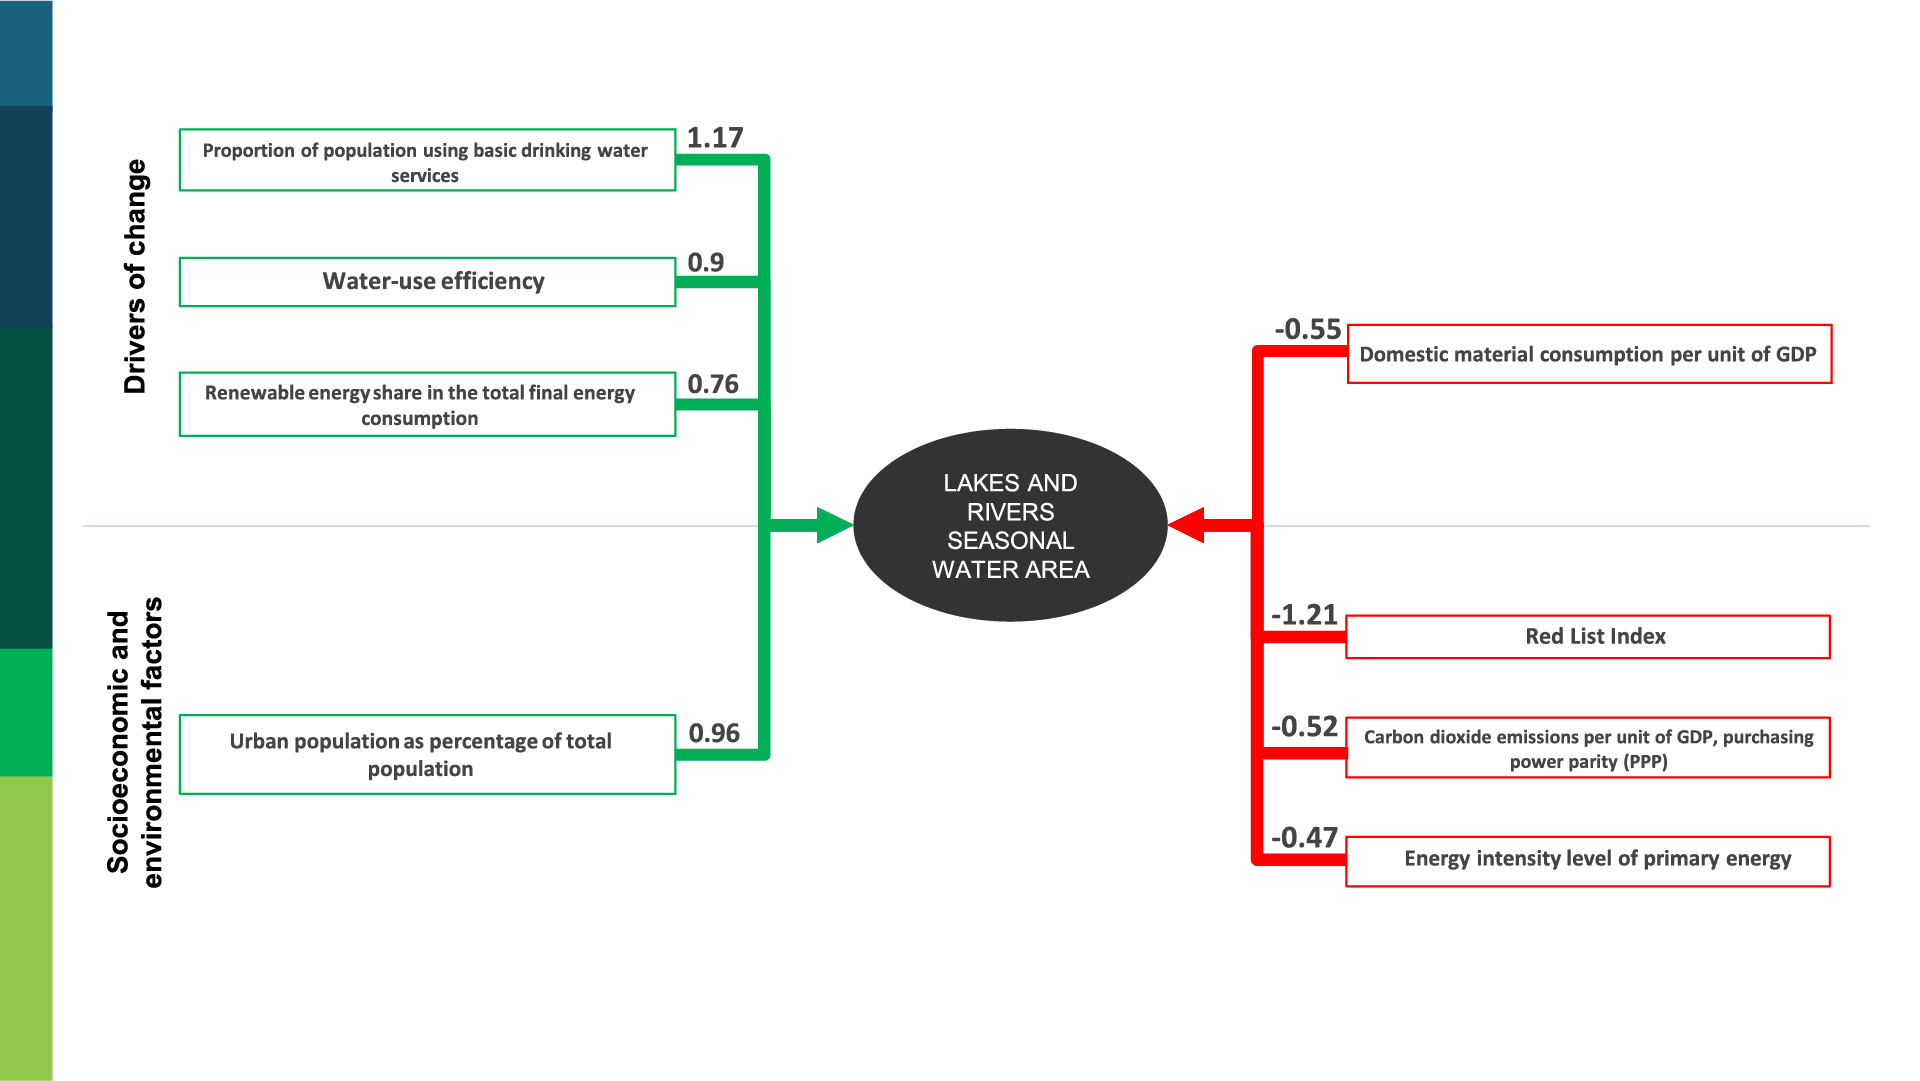
The statistical analysis identified a negative relationship between (a) SDG 9.4.1 on CO2 emissions per unit of GDP PPP, (b) SDG 7.3.1 on energy intensity level of primary energy, and SDG 6.6.1 subindicators on lakes and rivers seasonal water area. In Mongolia, 85 per cent of total energy supplied in 2019 originated from coal, with 97 per cent of electricity and heat generation CO2 emissions attributed to coal and other energy sources (IRENA 2022b). The increase in coal production in Mongolia since 2000, coupled with the water-intensive coal production sector, has had long-lasting impacts on ecosystem processes and ecosystem services; surface coal mining was responsible for the loss of 30 per cent of lakes larger than 10 km2 in the Mongolian Plateau (Ma et al. 2021). As previously discussed, an improvement in energy intensity level of primary energy (SDG 7.3.1) and CO2 emissions per unit of GDP PPP (SDG 9.4.1) (less values for energy intensity and CO2 emissions per unit of GDP) leads to the use of less water and an increase of lakes and rivers water area. The Mongolian data indicate an overall decreasing trend in energy intensity level of primary energy (SDG 7.3.1) and CO2 emissions per unit of GDP PPP (SDG 9.4.1) while the lakes and rivers seasonal water area (SDG 6.6.1) is overall increasing (UNSD 2022b).
b. SDG 6.6.1 sub-indicators on reservoirs water area (minimum and maximum)
Mongolia’s general models for reservoirs minimum and maximum water area (SDG 6.6.1) are almost identical for positive and negative relationship identified, except for the renewable energy share in the total final energy consumption (SDG 7.2.1) that is relevant to reservoir maximum water area only.
As presented in the lakes and rivers water area section, a positive relationship was identified between (a) SDG 1.4.1 on the proportion of population using basic drinking water services, (b) SDG 1.4.1 on urban population as percentage of total population and (c) SDG 6.4.1 on water-use efficiency and reservoirs minimum and maximum water area (SDG 6.6.1). The reliance on groundwater resources to supply communities in Mongolia shifts the pressure from surface-water resources, including reservoirs. In addition, the improvement of water-use efficiencies due to many factors, including more efficient water conveyance systems in urban settings, have been shown to reduce the pressures on freshwater resources (Shi et al. 2015; Onyenankeya, Onyenankeya and Osunkunle 2021; Civitelli and Gruere 2016).
As presented in the lakes and rivers water area section, Mongolia’s shift to renewable energy will exert less pressure on water resources and improve the quantities of water available, for example, in reservoirs.
The statistical analysis identified a positive relationship between (a) SDG 15.2.1a on the average proportion of freshwater KBAs covered, (b) SDG 15.2.1b on the average proportion of terrestrial KBAs covered and (c) SDG 15.4.1 on the average proportion of mountain KBAs covered with reservoirs minimum and maximum water area (SDG 6.6.1). These relationships were discussed in detail in previous sections, but in the context of Mongolia, many actions have been taken by the government that may have a positive impact on reservoirs water area from the perspective of biodiversity protection. Many national biodiversity conservation action plans were prepared and implemented to increase the State Special Protected Areas (SPAs) to 30 per cent by 2030 from 17.9 per cent (Mondal, Liu, Fatoyinbo and Lagomasino 2019). The government has designated sites as World Heritage sites, biosphere reserves as well as Ramsar Sites, Important Bird and Biodiversity Areas and Flyway Network Sites (WSCC n.d.).
Figure 4.17 General model for reservoir minimum water area, Mongolia
A negative relationship was identified between level of water stress (SDG 6.4.2) and SDG 6.6.1 sub-indicator on reservoirs minimum and maximum water area. As the withdrawal of freshwater resources leads to less water available for storage (Weber et al. 2017), an increase in level of water stress will lead to less reservoirs minimum and maximum water area (SDG 6.6.1), which the statistical analysis confirms.
A positive relationship was identified between GNI per capita and reservoirs minimum and maximum water area (SDG 6.6.1). The country’s extensive reliance on groundwater coupled with the impact of climate change on temperature makes it likely that Mongolian reservoirs water area have been expanding while the country has been increasing its GNI per capita steadily since 2010. Similarly, the improvement in manufacturing value added as a proportion of GDP (SDG 9.2.1) indicates an expansion of the sector and is expected to be negatively linked to water resource areas, such as reservoirs, unless environmentally sound practices are established.
The statistical analysis identified a negative relationship between (a) SDG 9.4.1 on CO2 emissions per unit of GDP PPP, (b) SDG 7.3.1 on energy intensity level of primary energy, and SDG 6.6.1 sub-indicators on reservoirs minimum and maximum water area. As presented in the lakes and rivers water area section, the improvement of energy intensity level and CO2 emissions per unit of GDP in Mongolia (coal represented 85 per cent of total energy supplied in 2019) might have positive implications on the reduction of water use in the energy production sector (Gao et al. 2018) by its potentially leading to an increase in water resources, specifically reservoirs water area. Similarly, the improvement (i.e. decrease) of domestic material consumption per unit of GDP (SDG 8.4.2/12.2.2), leads to decrease in water use, and therefore an increase in reservoirs water area (SDG 6.6.1).
Figure 4.18 General model for reservoir maximum water area, Mongolia
c. Conclusion
-
The strongest positive relationships with freshwater area in Mongolia were found to be linked to water-use efficiency, urban population, proportion of population with access to basic drinking water services and GNI per capita. The economic situation in Mongolia has been improving. More people are moving to urban areas, causing a shift in water dependency to groundwater resources. At the same time, the manufacturing industry and mining sector, in addition to the weak enforcement of regulations, are exerting pressure on water resources (Banerjee et al. 2014).
-
The strongest negative relationship was identified with CO2 emissions per unit of GDP. Given the extent and impact of Mongolia’s mining sector – specifically its water-intensive activities – on the country’s environment and water resources, laws and regulations to improve the efficiency of CO2 emissions per unit of GDP are needed, along with policies that encourage or enforce efficient and reduced water use by the sector.
4.2.2.2 State of the freshwater-related ecosystems’ impact on the state of human well-being
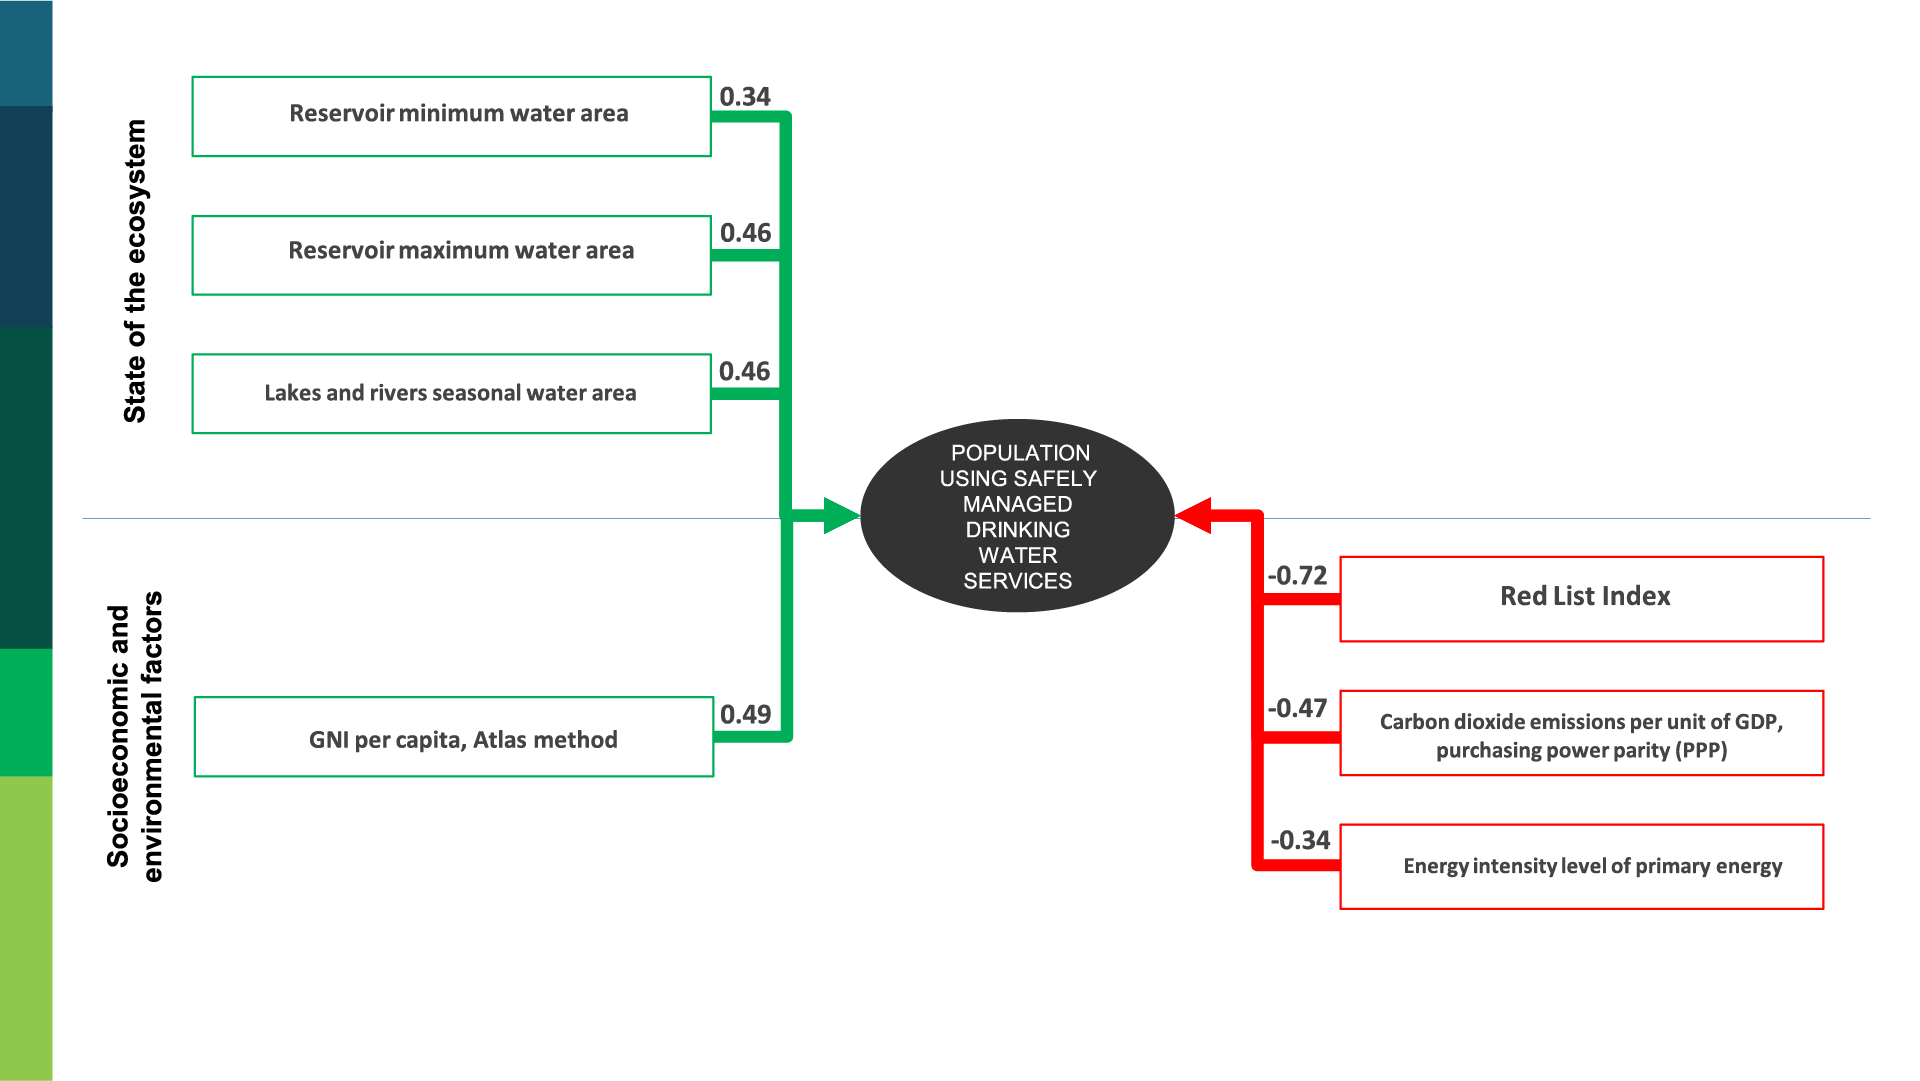
a. SDG 6.1.1 sub-indicator on proportion of population using safely managed drinking water services
Nationally, inhabitants of apartment buildings use safe water from centralized water supply systems (around 29 per cent), whereas those living in detached houses and traditional homes called “ger”[11] rely on other drinking water sources and are often not connected to centralized water and sanitation networks (around 64 per cent have access to safely managed drinking water services) (NSO Mongolia 2020). In Ulaanbaatar, more than 90 per cent of the city’s population has access to safe drinking water. Ger districts are home to about 60 per cent of the city’s population, while the majority of people in small towns and settlements in rural areas live in ger. Sources of drinking water for households in ger districts include public distribution points (kiosks) connected to centralized water supply networks; kiosks with purified water transported by trucks from the centralized water supply system; protected wells, springs and streams; unprotected wells and springs; and open water sources (rivers, lakes and ponds).
Furthermore, there are inequalities in water consumption between residents in apartment buildings and in ger districts due to the accessibility of water and different water tariffs. Water consumption in ger areas is limited to basic needs such as drinking, cooking and hygiene. In contrast, residents in apartment buildings consume as much as 270–350 litres per capita/day (UNESCO 2013). In addition, households in ger districts pay higher water tariffs compared with the tariffs paid by households in apartment buildings.
There is a positive link between the state of freshwater resources and ecosystems (SDG 6.6.1) and access to safe drinking water. Water pollution hinders access, while interventions to protect and improve water quality and ecosystem health grant populations better availability and quality of water resources for drinking and other uses. These relationships are particularly evident in Mongolia’s case due to the country’s diverse ecosystems and highly seasonal climate, as demonstrated by the positive relationships between the permanent and seasonal water area of lakes and rivers (SDG 6.6.1) and the proportion of population using safely managed water services (SDG 6.1.1). Mongolia’s surface-water flows and groundwater resources heavily depend on precipitations such as rainfall and snow. With an estimated 85 per cent of precipitation between April and September, the annual precipitation rarely exceeds 400 mm and is much lower in the southern and steppe regions, whereas the annual rainfall in the Gobi Desert is only 40 mm (MET of Mongolia 2018). This makes lakes and rivers highly vulnerable to climate variabilities. Furthermore, located in a cold climatic region, Mongolia’s lakes and rivers are seasonal and freeze during the winter months. Consequently, major cities and large human settlements rely on groundwater as a perennial source of drinking water supplies, compared with rural and nomadic populations, who rely on surface water bodies such as rivers, streams and springs for drinking water. Due to the seasonality of lakes and rivers, rural and nomadic populations use snow and ice for drinking water during winter. The impact of these climatic factors on the availability of water resources is demonstrated by the very weak relationship between permanent lakes and rivers and access to safe drinking water, and by a rather stronger relationship with the seasonal surface-water bodies.
Mongolia’s total water reserve mainly consists of natural water reservoirs, with only few small-scale artificial reservoirs. The positive relationship between reservoirs minimum and maximum water area (SDG 6.6.1) and access to safe drinking water may be due to the additional water supplies provided by the construction in 2008 of the Taishir Hydropower Project on Zavkhan River in the western region of Mongolia and the completion of the Taishir- Altai Water Supply Project, which provides drinking water supplies for the city of Altai in Gobi-Altai Province (an aimag). Since 2021, inhabitants of Altai use purified water from the reservoir (an artificial lake called Gegeen) of the Taishir Hydropower plant. Thus, Altai has become the first city in Mongolia to use a surface-water reservoir as a drinking water source.
Because of the high seasonal variability of river flows and the tendency of rivers to freeze in winter, groundwater is tapped as Mongolia’s main water source for drinking and industrial water supplies. At the same time, the valuable and fragile ecology of the country necessitates the maintenance of high environmental flow requirements. Mongolia needs to prepare for climate change adaptation, as it may become a major challenge (ADB 2020b).
A country’s economic development is one of the key factors that defines its level of access to safe drinking water, as economic growth provides financial resources for investments in the water and sanitation sector. Likewise, improvements in socioeconomic conditions of a population, such as increased GDP and GNI per capita, result in better access to safely managed drinking water and sanitation services. Mongolia’s GNI per capita has almost doubled in the 2010–2021 period (WB 2022b). Its economic growth is undeniably one of the key factors benefiting its population, particularly those who have lacked access to safe drinking water, as shown by the strong positive relationship between GNI per capita and the proportion of population using safely managed drinking water services (SDG 6.1.1).
Figure 4.19 General model for population using safely managed drinking water services, Mongolia
The statistical analysis identified a positive relationship between urban population as proportion of total population and the proportion of population using safely managed drinking water services (SDG 6.1.1). Rapid urbanization due to rural-urban migration in Mongolia is another key factor in the increase of access to safe drinking water, as centralized water supply and sewerage services are mainly limited to urban areas, demonstrated by the access of more than 90 per cent of the city’s population to safely managed drinking water services.
Manufacturing makes a very modest contribution (8 per cent) to the country’s GDP (WB 2022b), while mining constitutes the main economic pillar. Nonetheless, an expansion of the sector is expected to carry negative impacts on the water resource areas.
As discussed in the section above, the decrease in CO2 emissions per unit of GDP (SDG 9.4.1) and in the energy intensity level (SDG 7.3.1) implies the increase in freshwater resources. This increase, coupled with government action to improve the quality of water supplied, may lead to an increase in the proportion of population using safely managed drinking water services (SDG 6.1.1).
b. Conclusion
-
Mongolia has made progress in providing its population with access to safe drinking water. However, with the current modest rate in the increase of the proportion of population using safely managed drinking water (SDG 6.1.1), the full achievement of SDG target 6.1 by 2030 is unlikely. Scaling up investment in water and sanitation, especially in rural areas, is essential. To address the stark inequalities in access to safe drinking water among urban and rural populations and across social and spatial spheres, human rights-based policies targeting rural populations and ger area residents are equally important to ensuring that no one is left behind. Improvements in water resources management and access to water supply and sanitation services are essential for the same reason, such that no one is left behind when it comes to enjoying the multiple benefits and opportunities that water provides (WWAP 2019).
4.3 Interlinkages analysis of freshwater-related indicators at the subnational level
4.3.1 Impact of drivers of change on the state of freshwater-related ecosystems
a. Basin level: China
Map 4.3 Official map of China (United Nations, 2022)
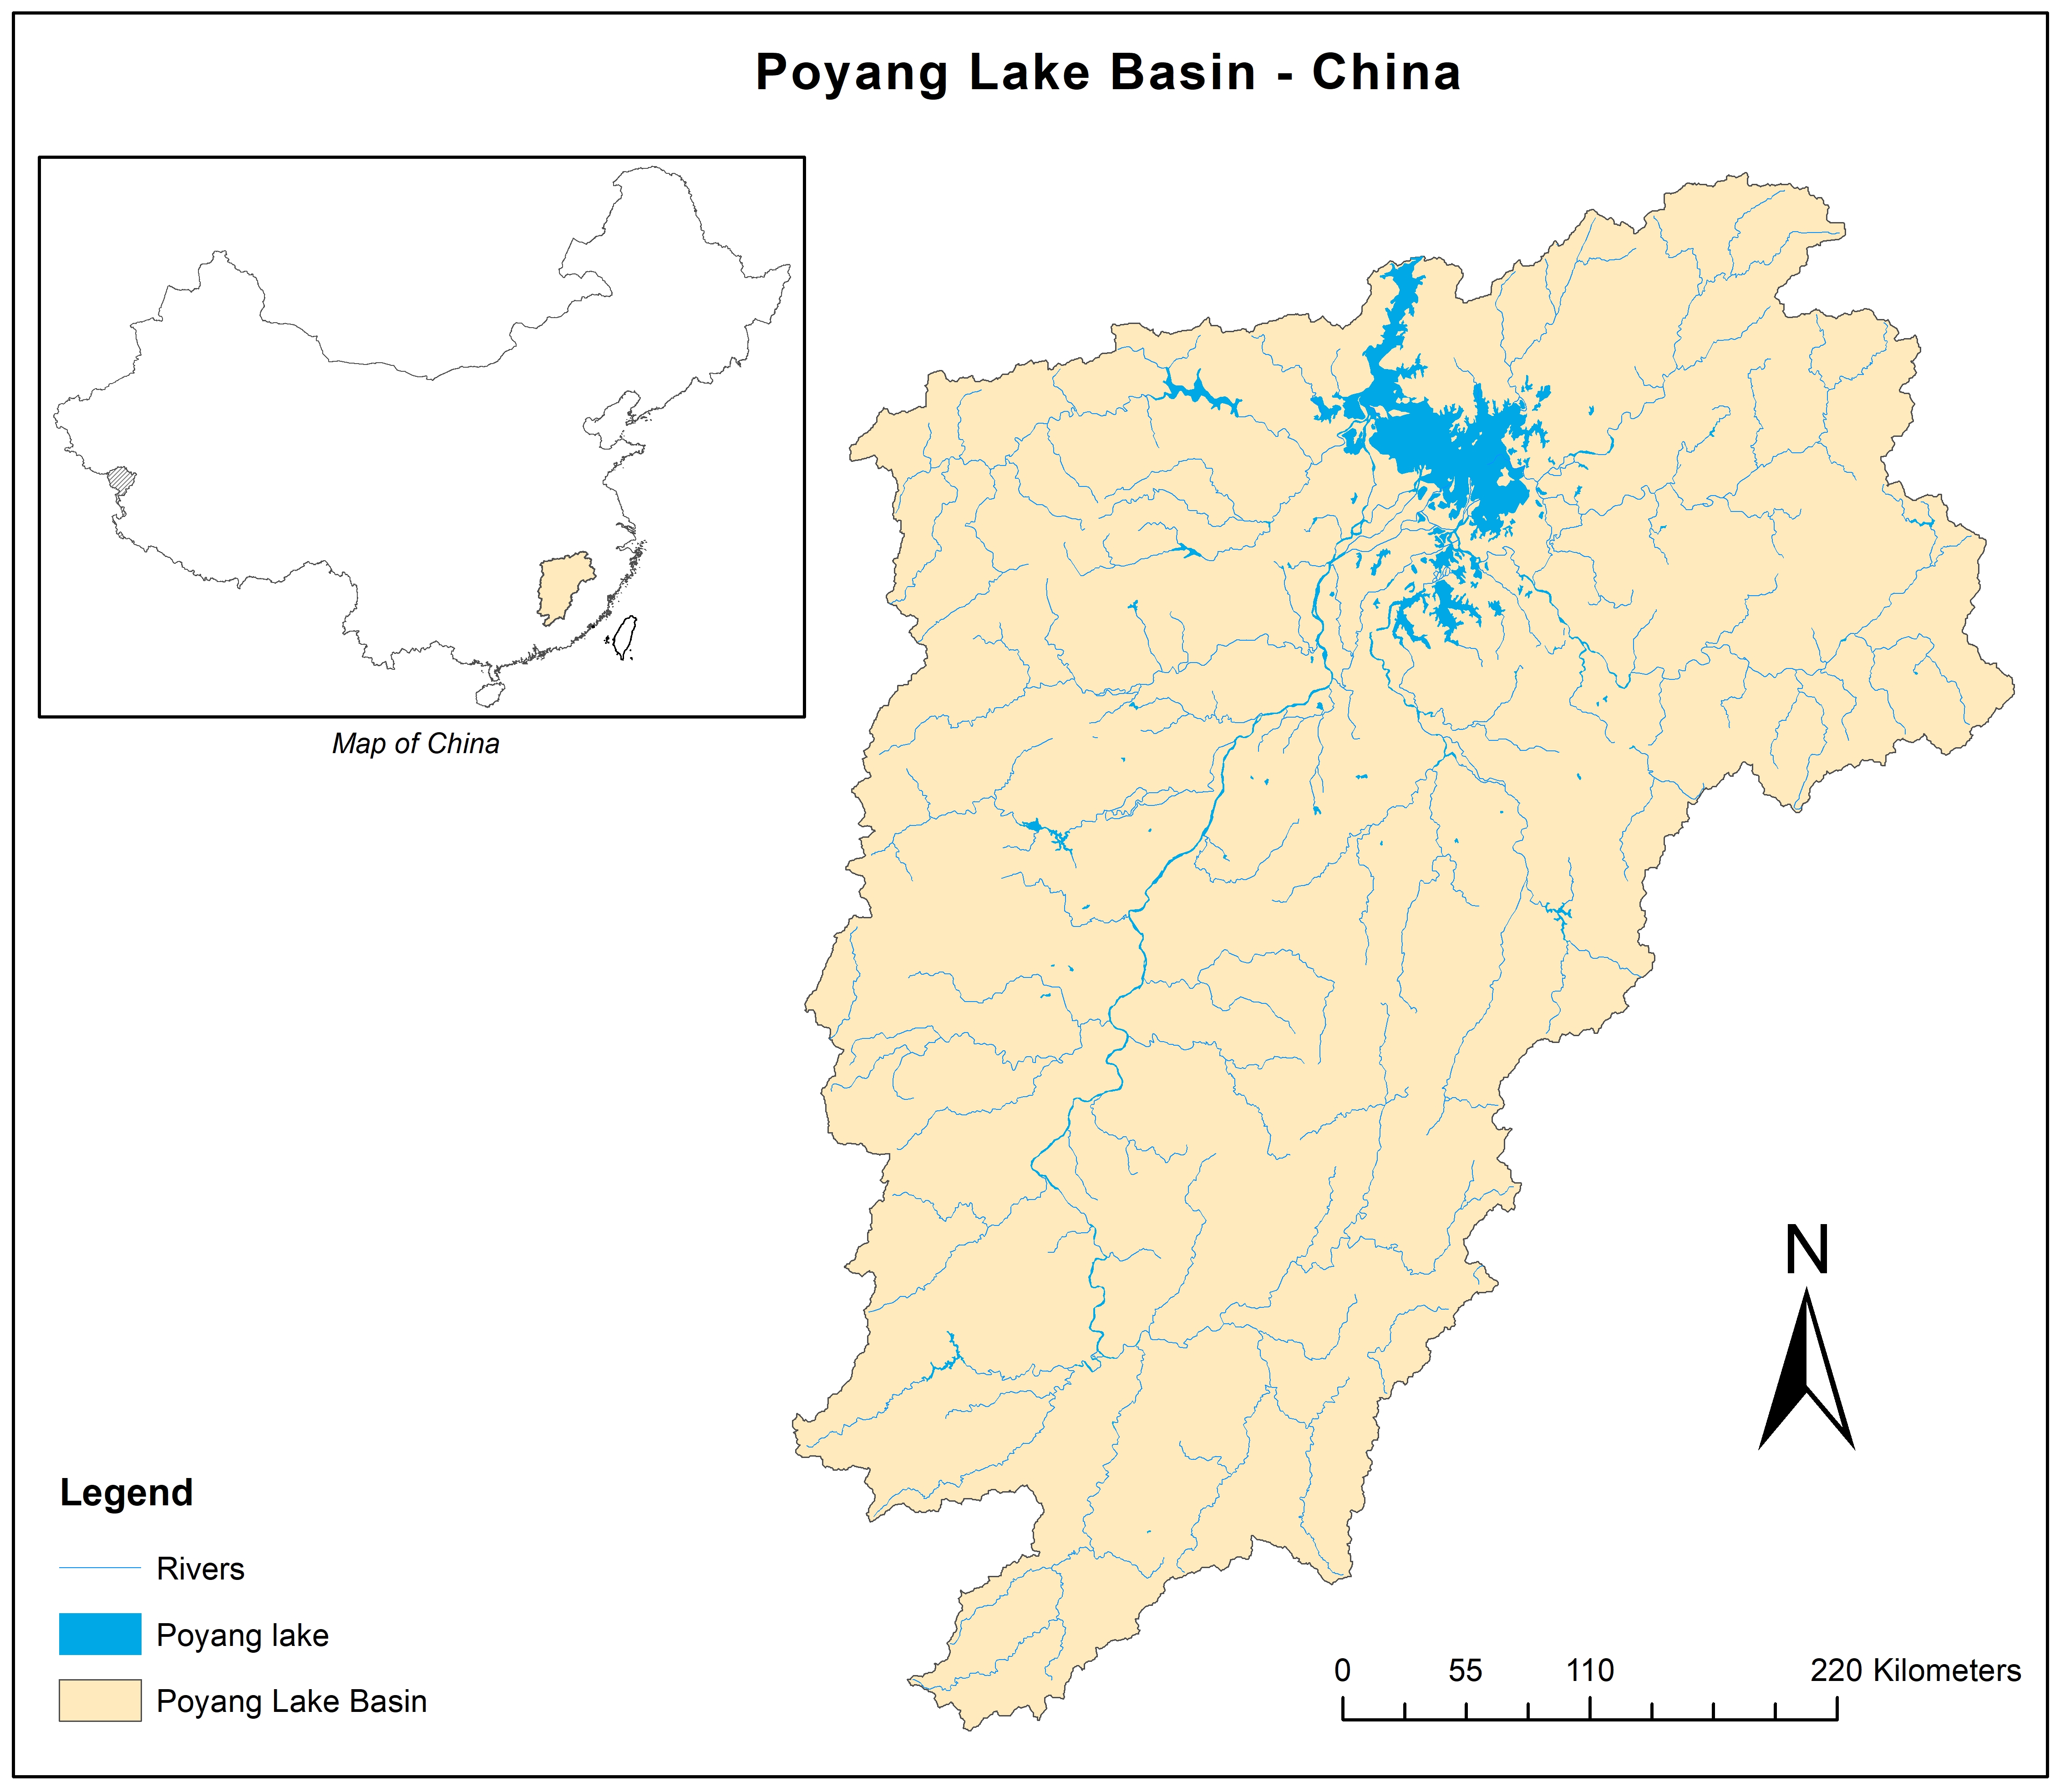
In such a spatial unit where various elements of the natural ecological environment interact and depend, exploring and understanding its synergies and trade-offs bring considerable value to accurately managing regional problems, ensuring policy coherence and promoting concrete actions (Zhou et al. 2022; Renaud et al. 2020). However, continuous, accurate and reliable time-series data remain an important prerequisite (Adeoti 2020). Considering the perspective of regional representativeness and data availability, this section clarifies the relationship between water-related ecosystems at the watershed scale and SDGs by taking as case study the Poyang Lake basin, the subwatershed of the Yangtze River basin in China.
China is divided into 10 first-level water resources regions or zones, 80 secondary zones and 214 third-level zones. Each water resource region combines watershed and administrative areas, which offer an integrated perspective and information about basin-level water resources. The data used for the basin-level analysis are using the secondary level zoning of national water resources in China, to which the Poyang Lake basin belongs. The Poyang Lake basin is located on the southern bank of the middle and lower reaches of the Yangtze River, which overlaps with the administrative areas of the Jiangxi Province. It consists of Ganjiang River, Fuhe River, Xinjiang River, Raohe River, Xiushui River and its tributaries at all levels, plus Qingfengshan River, Boyang River, ZhangTian River, Tongjin River and other small rivers that flow into the lake alone. The basin is about 620 km long from north to south and 490 km wide from east to west. The basin area is around 162,225 km2, of which 156,743 km2 is located in Jiangxi (accounting for 96.6 per cent of the basin area) (Lei et al. 2021). The remaining 5,482 km2 belongs to Fujian, Zhejiang, Anhui, Hunan, Guangdong and other provinces, accounting for about 3.3 per cent of the basin area.
Poyang Lake is the largest freshwater lake in China and constitutes a major hydrological subsystem of the middle Yangtze basin (Shen et al. 2022). It has been listed as an ecoregion in World Wildlife Fund’s Global 200 (Huang, Wu and Li 2013). Therefore, Poyang Lake plays a crucial role in maintaining and supplementing the aquatic biodiversity of the Yangtze River (Jin et al. 2012).
The proportion of waterbodies with good ambient water quality (SDG 6.3.2) is used as the dependent variable to reflect the state of freshwater-related ecosystems. The 27 indicators are used as drivers of the freshwater-related ecosystem change, which are tested with the 11 socioeconomic and environmental factors. Between 2004 and 2019, SDG 6.3.2 shows an increasing trend, as do the seven driver indicators (freight volume, passenger traffic, railway passenger traffic, road freight volume, road passenger traffic, water freight volume, and harmless treatment rate of domestic waste) and six socioeconomic and environmental factors (GDP per capita, industrial waste gas treatment facilities, forest cover rate, urban population as percentage of total population, comprehensive utilization rate of industrial solid waste, and freight volume). However, a decreasing trend can be seen in the rail freight volume, waterway passenger traffic, industrial wastewater discharge, average level of particulate matter and industrial sulfur dioxide emissions.
Out of the 27 indicators of drivers of change, only four have shown a statistically significant relationship with SDG 6.3.2 on the proportion of waterbodies with good ambient water quality.
Figure 4.20 General model for proportion of bodies of water with good ambient water quality, Poyang Lake basin, China
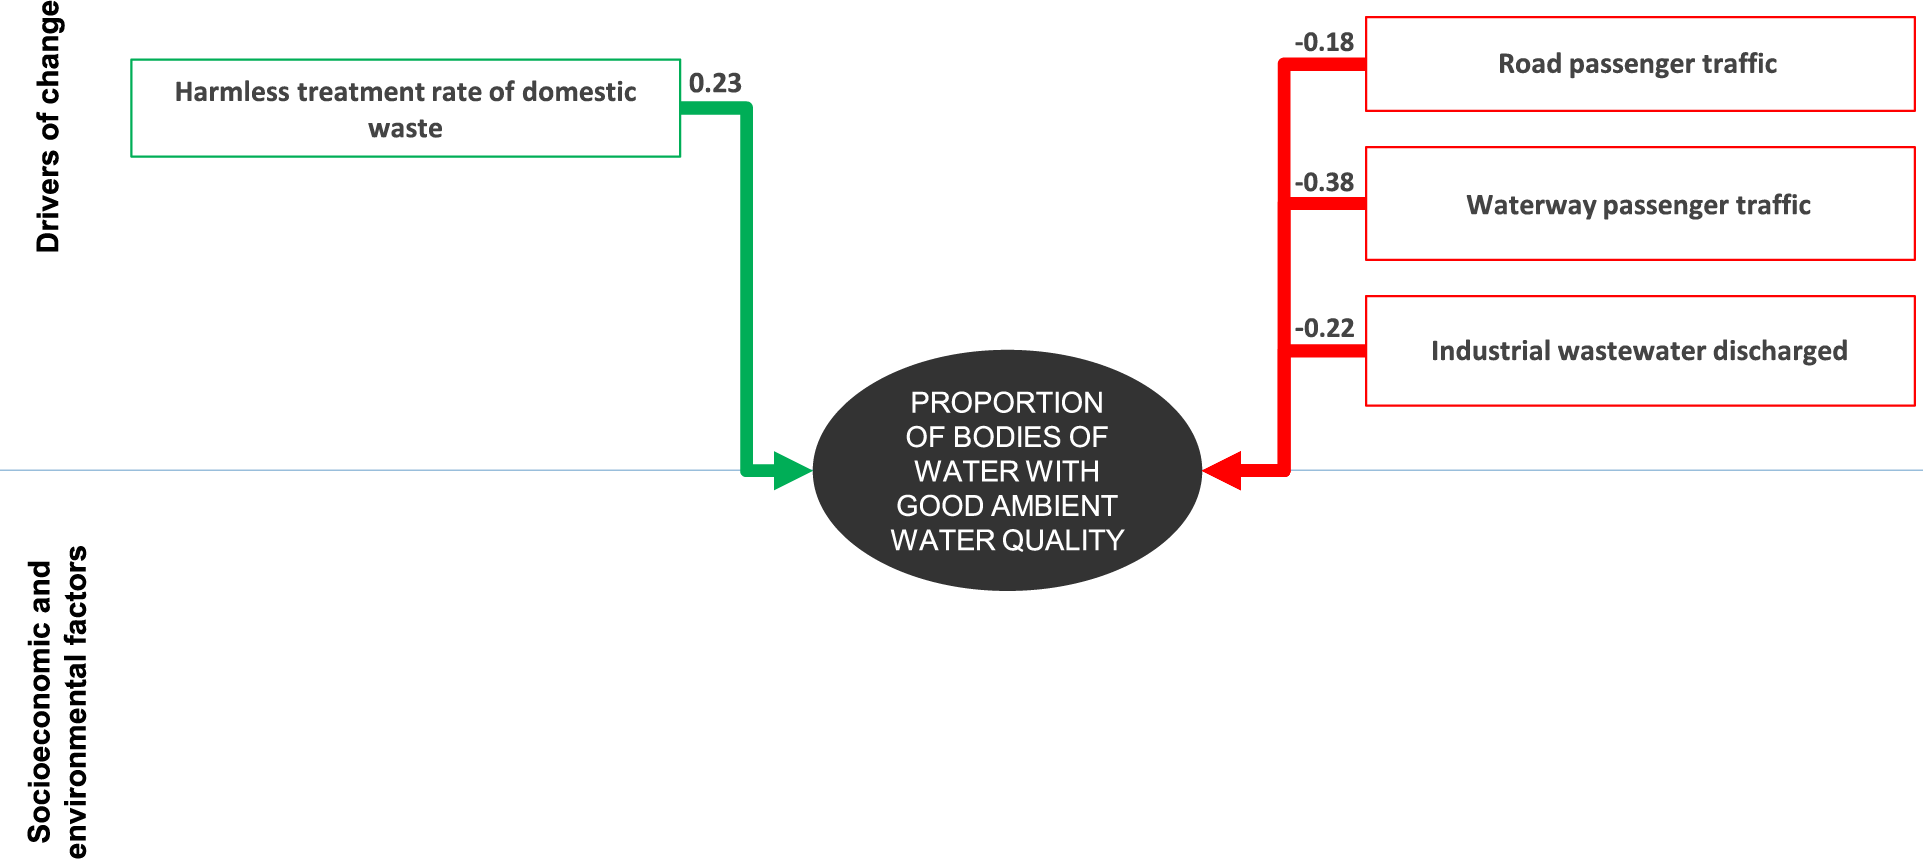
The harmless treatment rate of domestic waste has a positive relationship with SDG 6.3.2 on the proportion of bodies of water with good ambient water quality. Water pollution in China is generally considered significant as it impacts the health of ecosystems and humans (Ma et al. 2020). In the Poyang basin in 2016, wastewater treatment was below national average (Jiangxi Provincial Development and Reform Commission 2016). As domestic waste is a key source of water pollution, its reduction and harmless treatment is vital for improving water quality (Arum, Harisuseno and Soemarno 2019). According to Jiangxi’s Province Domestic Waste Classification and Treatment Facility Development Plan (2021–2025), the harmless or environmentally sound treatment rate of domestic waste in cities and counties across the province is higher than the national average. This is an important environmental governance initiative for the improvement of water quality in the Poyang Lake basin.
On the other hand, the waterway passenger traffic has a negative relationship with SDG 6.3.2 on the proportion of bodies of water with good ambient water quality. The statistical analysis implies that an increase in waterway passenger traffic would lead to a decrease in the proportion of waterbodies with good ambient water quality. The same is implied for road passenger traffic. Inland waterway traffic, based on the literature, is found to be more efficient than road transport, as it consumes less energy, costs less, emits less CO2 and has larger freight capacities compared with other modes of transport (Li et al. 2022; de Barros et al. 2022). A study on the impact of inland waterway transport was conducted for the Yangtze River, of which Poyang Lake is a part. The study reveals that ecological functions (including biodiversity) of the various reaches of the Yangtze River (upper, middle, middlelower and lower) were all assessed between bad, poor and fair, alongside identified threats such as habitat loss, water pollution, overexploitation and alternations of hydrological regimes (Li et al. 2022). In addition, sanitary sewage, oily wastewater and domestic solid wastes discharged from ships impact the quality of the waterways (Jiao and Liu 2018). This is confirmed by the negative relationship between waterway passenger traffic and SDG 6.3.2 and by the data, which shows that between 2004 and 2019, the waterway passenger traffic has been decreasing while the quality of the waterbodies has been improving since.
In addition to waterway passenger traffic, the statistical analysis indicates a negative relationship between road passenger traffic and SDG 6.3.2 on water quality. Generally, the increase of road passenger traffic will have a negative impact on the surface-water and groundwater environment (Kalman and Laszlo 1997; Uliasz- Misiak et al. 2022). Although road traffic is usually positively linked to air pollution in cities and urban areas, a study in Canada found that chemical compounds found in vehicle fluids, tyres and paints are major causes of water pollution in nearby streams due to heavy traffic. This is due to the deposition of such chemicals on roads that end up in river streams after raining, causing water degradation (Awonaike et al. 2022).
There is a negative relationship between industrial wastewater discharge and SDG 6.3.2 on water quality. Industrial wastewaters are known to be toxic and are a major cause of irreversible damage to the ecosystem. They not only pollute groundwater, but also major waterbodies. They include a variety of compounds toxic to freshwater species and humans, including chemicals, heavy metals, oils, pesticides, silt, pharmaceuticals and other industrial by-products (Ahmed, Thakur and Goyal 2021). There can be no doubt that the relationship is negative. In the Poyang Lake basin, the industrial wastewater discharge decreased from 2004 to 2019, which has improved the quality of the water.