
3. Methodology
3.1 Theory of change

3.2 Analytical approach
3.2.1 Definition of components
The statistical model features four types of components. Indicators within the first three components (drivers of change, state of the ecosystem and state of human well-being) are all selected from the SDGs indicator framework.
- Drivers of change indicators include drivers, pressures and responses from the DPSIR model. They are indicators related to water and marine management, protection and/or restoration actions. Drivers of change are considered as an independent[5] variable in the analysis. The drivers are identified as direct human influences on nature and considerations used as a basis for human choices impacting nature (IPBES 2019), while pressures are factors that lead to changes in the state of the ecosystem, and responses are actions being taken to address those drivers and pressures.
- State of the ecosystem indicators refer to the state of freshwater- and marine-related ecosystems. They are related to the quality, abundance and habitats of freshwater- and marine-related ecosystems and are considered as dependent[6] variables in the analysis of the effect of drivers of change on the ecosystems.
- State of human well-being indicators concern the social impacts of the state of the ecosystem. They are considered as dependent variables related to the state of freshwater- and marine-related ecosystems.
- Socioeconomic and environmental factors are a group of indicators from within and outside the SDG indicator framework that might influence the relationship between the different groups of indicators (drivers of change, state of the ecosystems and state of human well-being). They are divided into five categories according to their nature: economic and social, physical infrastructure, human infrastructure, environment and natural resources. Section 2.3 provides a detailed perspective on the nature of these factors.
3.2.2 Theoretical models specifications
After defining the components of the statistical analysis, identifying and classifying SDG indicators into the above-identified categories was imperative (Figure 3.1). The selection of the indicators was done at the indicator level and separately for each type of ecosystem, considering the specificities of each ecosystem type according to experts’ knowledge.
Figure 3.1 Statistical analysis steps
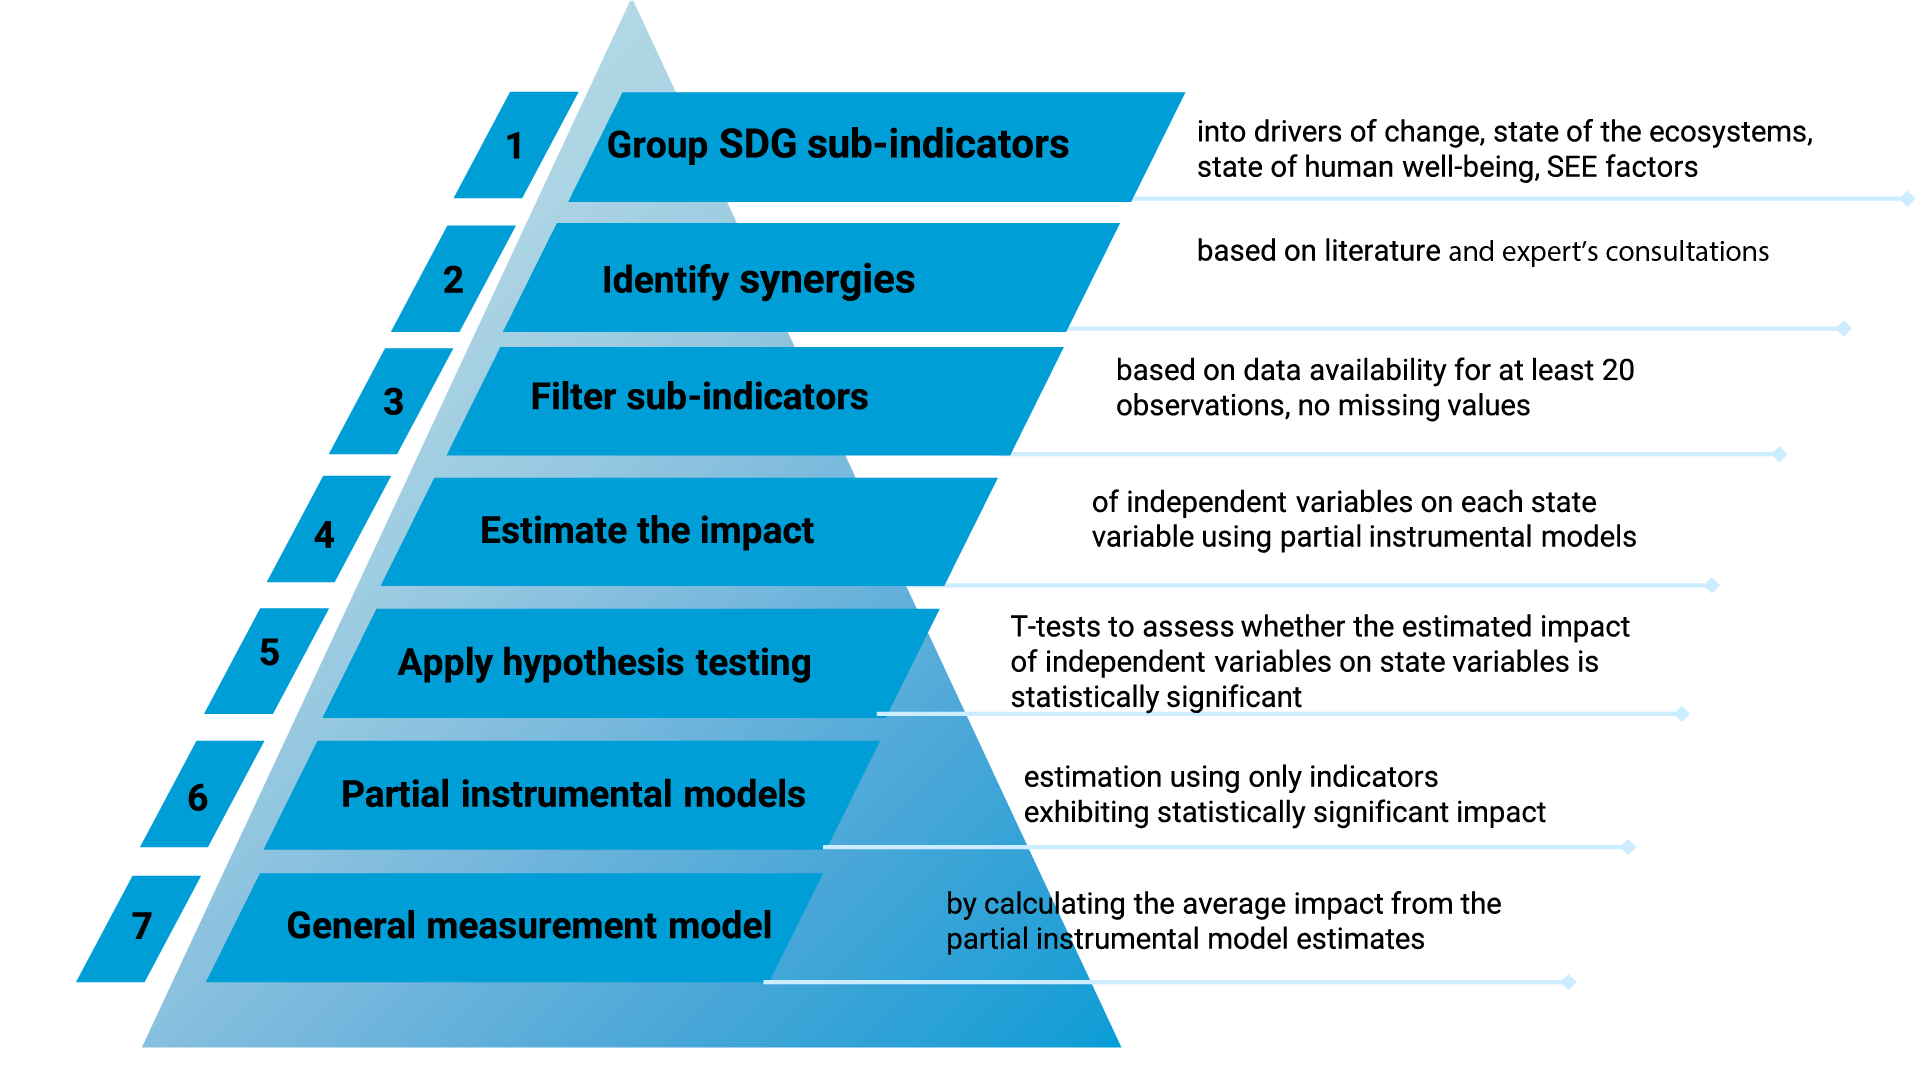
Potential synergies were then identified between the selected indicators for further analysis (see Annex E). Potential synergies are based on the potential impact that one indicator (independent variable) might have on another indicator (dependent variable). An initial identification of potential synergies was complemented by online experts’ consultation. Theoretical models were then developed for the analysis of the state of freshwater- and marinerelated ecosystems and their impact on human well-being.
The next step entailed setting the criteria for data to be used in the statistical analysis. For global and national data, the number of observations was set to a minimum of 20 observations, no gaps in the time series and using available data to date. For global-level data, the criteria were set to have data from at least 50 per cent of the countries for a global aggregate to be generated. This aligns with UNEP’s methodology to aggregate data to the global level. Global aggregates (i.e. one value representing global value for one year) were used in the statistical analysis, in comparison with country data. Specifically for marine-related ecosystems, the 45 landlocked countries were excluded from the analysis due to their lack of direct accessibility to and benefit from marine and coastal areas.
Table 3.1 Percentage of sub-indicators of which data are available from the proposed list in the theoretical models, freshwater and marine
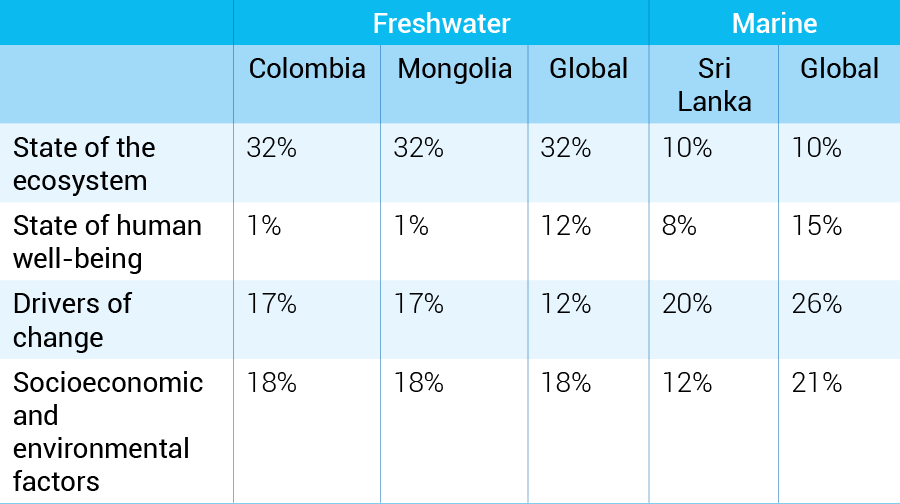
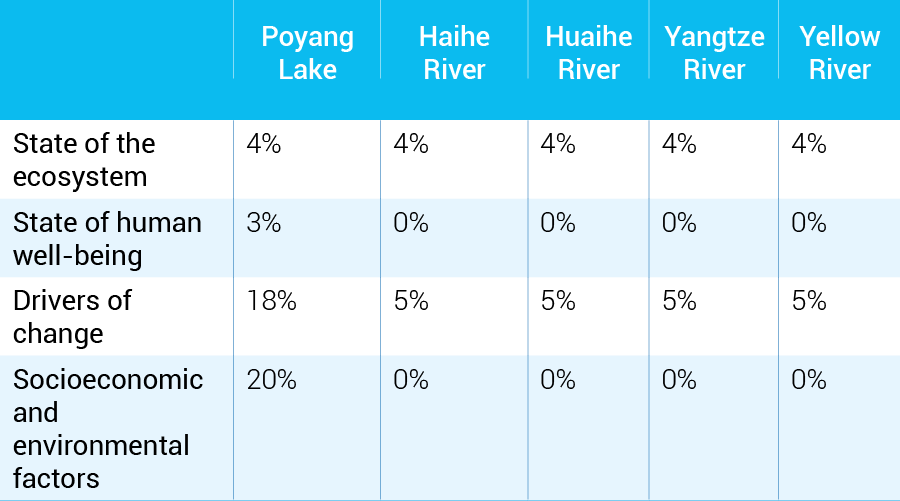
Table 3.2 Percentage of sub-indicators of which data are available from the proposed list in the theoretical model for basin-level analysis
Multiple sources of data were used for this analysis. For SDGrelated indicators, data were extracted from the SDG Indicators Database on 14 June 2022. Subsequent updates of the database were not considered in this analysis. Other sources were used, such as the Department of Economic and Social Affairs, Population Division[7] and the World Bank.[8]
For basin-level analysis, the number of observations was set to 15, with the time series starting from 2004 until the most recent available data without data gaps in the time series. Basin-level data were provided by the Government of China (received on 22 June 2022).
One of the main challenges of this analysis is related to the lack of data at the global and national levels. This point is very relevant, because only a partial study of the theoretical models has been done. Only some of the proposed sub-indicators had available data due to the numerous missing data existing in the time series. This limitation requires the design of an ad hoc measurement methodology, achieving an equilibrium between (i) the demanding requirements of the theoretical models and actual policy impact dissemination mechanisms and (ii) the data that can be used to measure such impacts. The following approaches were used to achieve this equilibrium:
- Impact is approached as a combination of partial correlation and time arrow to discriminate correlation (symmetric) from impact (asymmetric, pointing out future from the past). By considering partial correlation, one can discriminate the effect of the variable whose impact is being measured from the potential effects of other drivers or socioeconomic and environmental factors. Considering a time lag, one can break the symmetry of partial correlations, since past can affect the future but the future cannot change the past.
- Impact dissemination patterns are modelled as simple but not limited to linear effects.
- Impact intensities of different drivers and socioeconomic and environmental factors are made comparable through variable standardization.
- Statistical models are being used as instrumental impact measurement models and not as predictive tools.
- The information from instrumental measurement models is integrated in a general impact measurement model summarizing the results of the instrumental models and providing a unique comparable measurement of the intensity of each impact.
To avoid the restriction of linear impact diffusion and the comparability of the impact being measured, and to homogenize the estimated impact (indicators’ units vary, that is, by per cent, age, km2, US$ and so on), all indicators’ data were transformed and standardized before the estimation of the instrumental models by using the logarithmic transformation.
The number of available variables in the theoretical model is larger than the number of available observations of each variable. Therefore, only partial instrumental models (i.e. models including a small subset of explicative variables) can be estimated.
To produce the general measurement model, all potential models including a strategy of three explanatory variables were estimated using ordinary least squares. The number of explanatory variables has been selected as the minimum number to estimate partial correlations instead of total correlations. The methodology opts for the minimum number of explanatory variables to maximize the degrees of freedom of the model and avoid model overfitting. Hence, instrumental models for which less than two coefficients are found to be statistically significant are dismissed. The regression models for each state variable are estimated independently. Formally, the instrumental regression for each ecosystem can be written as
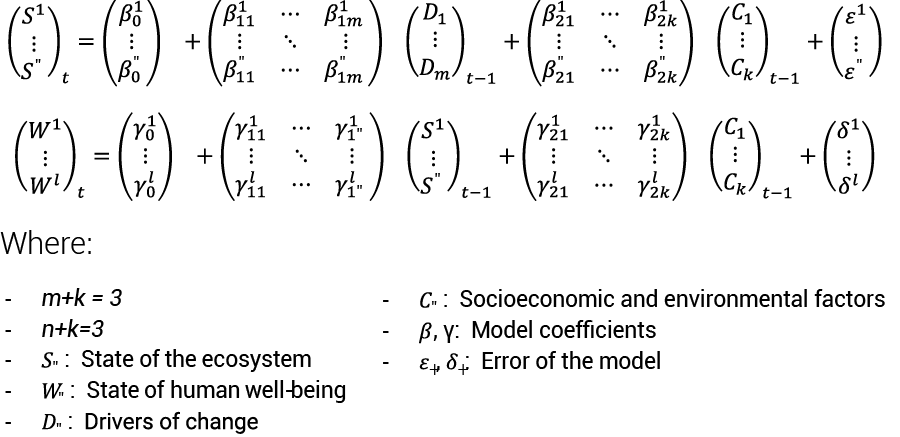
After the estimation, the t-test is applied to test the null hypothesis for each individual impact coefficient being null at a significance level of 0.05. Models are re-estimated after the elimination of one non-significant coefficient, providing a measure of the intensity of impacts that can be considered as non-null. This impact measure is given by the corresponding estimated coefficient (β for impact in the state of the ecosystem and ϒ for impact in the state of human well-being). The value of the estimated coefficients that are significantly non-null for all the instrumental models for each response variable is presented below and used to conduct the following analysis of the results.
3.3 Presentation of results
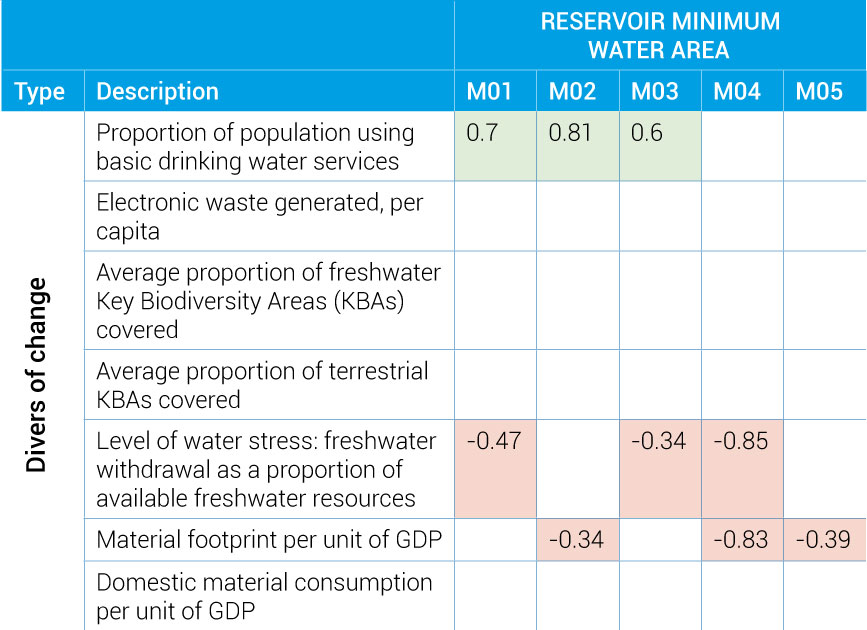
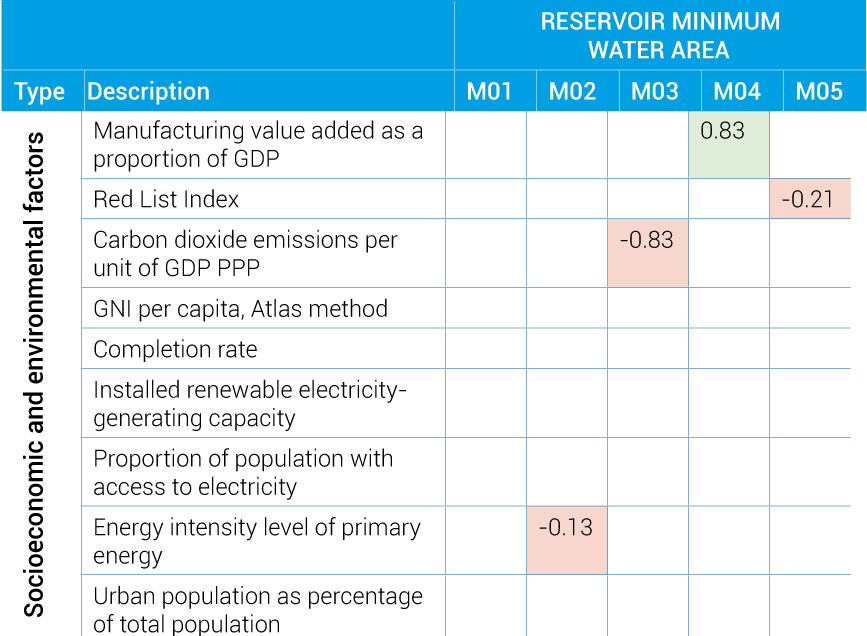
- There are five instrumental models (denoted as M1 through to M5) for which at least two coefficients are significantly non-null.
- All indicators presented above were tested.
- Indicators showing no coefficients were found to be statistically insignificant.
- Green cells indicate positive coefficients; red cells indicate negative coefficients.
- Indicators located above the blue line are considered as direct drivers indicators.
- Indicators located below the blue line are considered as socioeconomic and environmental factors.
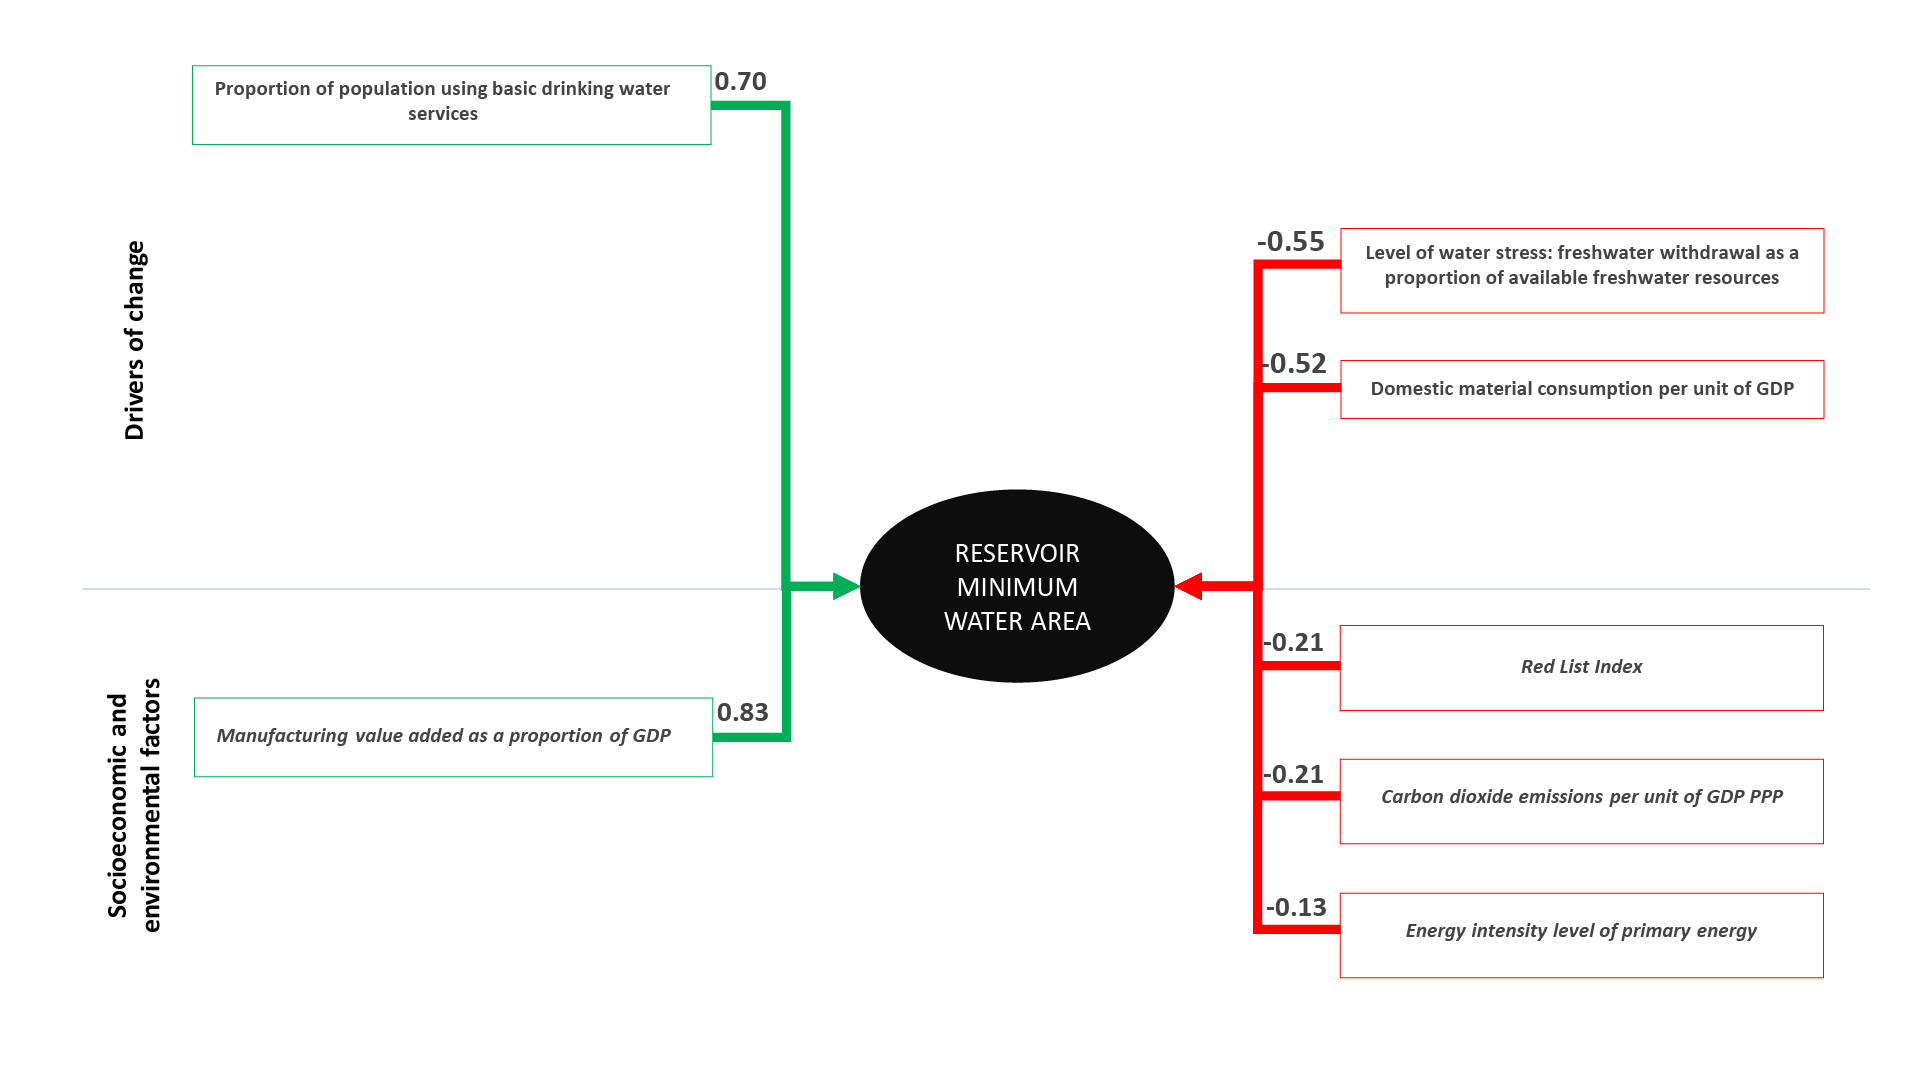
- The indicator located in the centre is the dependent variable, while all other indicators are considered independent.
- Green indicates a positive relationship (an increase of the explanatory variable (driver or socioeconomic and environmental factor) and translates into an increase in the level of the response state variable).
- Red indicates a negative relationship (an increase of the explanatory variable (driver or socioeconomic and environmental factor) translates into a decrease in the level of the response state variable).