
5. Marine-related ecosystems

SDG 14 is the dedicated goal towards the conservation and sustainable use of the oceans, seas and marine resources. This goal includes 10 targets and 10 indicators related directly to marine-related ecosystems. Yet only three indicators represent a picture of how the state of the environment is evolving: (a) SDG 14.1.1 on coastal eutrophication and plastic debris density, (b) SDG 14.3.1 on the average marine acidity measured at agreed suites and (c) SDG 14.4.1 on the proportion of fish stocks within biologically sustainable levels. However, only SDG 14.1.1a on coastal eutrophication, and more precisely the sub-indicator on chlorophyll-a deviations, had data compliant with the requirements of the statistical analysis. The following analysis focuses on the interlinkages of chlorophyll-a deviations with identified drivers of change and state of human well-being indicators.
5.1 Introduction: Chlorophyll-a deviation measurements
Due to the high correlation between chlorophyll-a and nutrient concentrations, this pigment can be used as an indicator of some bottom-up aspects of the trophic status for various waterbodies. Although measurements of water quality through in situ sampling methods demand considerable time, money and human resources, chlorophyll-a can be quantified with remote sensing technologies, offering a novel and powerful source for large-scale monitoring of surface-water quality in both freshwater and marine environments.
Chlorophyll-a deviation measurements are derived from the European Space Agency’s “Ocean Colour Climate Change Initiative” project and generated for each individual pixel (4 km resolution, monthly products) within a country’s exclusive economic zone (EEZ) (Groom et al. 2019). In order to generate a climatological baseline, results were averaged by month between 2000 and 2004. The percentage of pixels in a country’s EEZ and/or territorial waters identified as deviating from the baseline (falling in the ninetieth percentile) were calculated for each national EEZ and/or territorial waters by month. Finally, the annual average of these monthly values was calculated.
However, analysing chlorophyll-a deviations has some limitations. The indicator itself (context and geographical scale) has been accepted as a good proxy for the trophic status of several waterrelated ecosystems. This is valid when values obtained for this variable are analysed in the right local context and on a suitable geographical scale. The consideration of key variables of the sampling area – such as catchment proximity and discharge flow of rivers, quality (degree and type of pollution) of these watercourses, existence of urban, agricultural or industrial effluent discharge points, and local water circulation and marine currents – is a fundamental factor that must be taken into account when interpreting results obtained from satellite images. In line with this, the choice of an appropriate scale of observation, which allows the identification, weighting and analysis of all these factors, is another essential factor. It is central that the inclusion of these variables is methodologically incompatible with a global-scale analysis.
5.2 Interlinkages analysis of marine-related indicators at the global level
The statistical analysis results indicated a negative relationship between chlorophyll-a deviations (SDG 14.1.1a) and SDG 14.5.1 sub-indicators:
- coverage of protected areas in relation to marine areas (EEZ);
- protected marine areas (EEZ);
- average proportion of marine KBAs covered by protected areas (SDG 14.5.1).
The negative relationship suggests that the increase in the coverage of protected areas in relation to marine areas may correspond to a decrease in chlorophyll-a deviation.
Factors such as sedimentation, plastic pollution, oil spills, climate change, eutrophication and the risk of introduced pests are only rarely addressed in the context of marine protected areas (MPAs) (Kriegl et al. 2021). It would be problematic if MPAs collectively had any impact on measured changes in chlorophyll-a or on the risk of eutrophication in a nation’s coastal waters. In addition, there is no literature suggesting that MPAs have induced any changes in planktonic primary production although some studies indicate an increase in macroalgae abundance after some MPAs have been established (Gilby and Stevens 2014). Thus, these correlations are unlikely to reflect causality, but could reflect other underlying patterns. For example, jurisdictions, with the policies and resources to effectively reduce nutrient loading in watersheds and estuaries, may also be likely to have policies and resources sufficient to also establish more or larger MPAs.
The statistical analysis indicated a negative relationship between chlorophyll-a deviations (SDG 14.1.1a) and SDG 6.6.1 subindicators:
- lakes and rivers seasonal water area;
- reservoir minimum water area;
- reservoir maximum water area.
From the point of view of coastal eutrophication, building dams may impede transmission of excess nutrients and be beneficial, or it may change the chemical balance of nutrients and cause a coastal eutrophication problem. Two thirds of rivers globally are now dammed and no longer free flowing (Grill et al. 2019). The situation in every river catchment must be separately analysed to know if the dam is associated with a change in aquatic nutrient levels, and if so, develop targeted actions to address any downstream issues with excess nutrients. The impact of dams and reservoirs on coastal eutrophication depends on the timing of the release of the water stored in dams. The timing of delivery is changed in cases where dams withhold water for human use and release water when it is not needed. This results in the river’s natural flow, which may have seasonal peaks and troughs, becoming smoothed and more uniform all year round (Maavara et al. 2020).
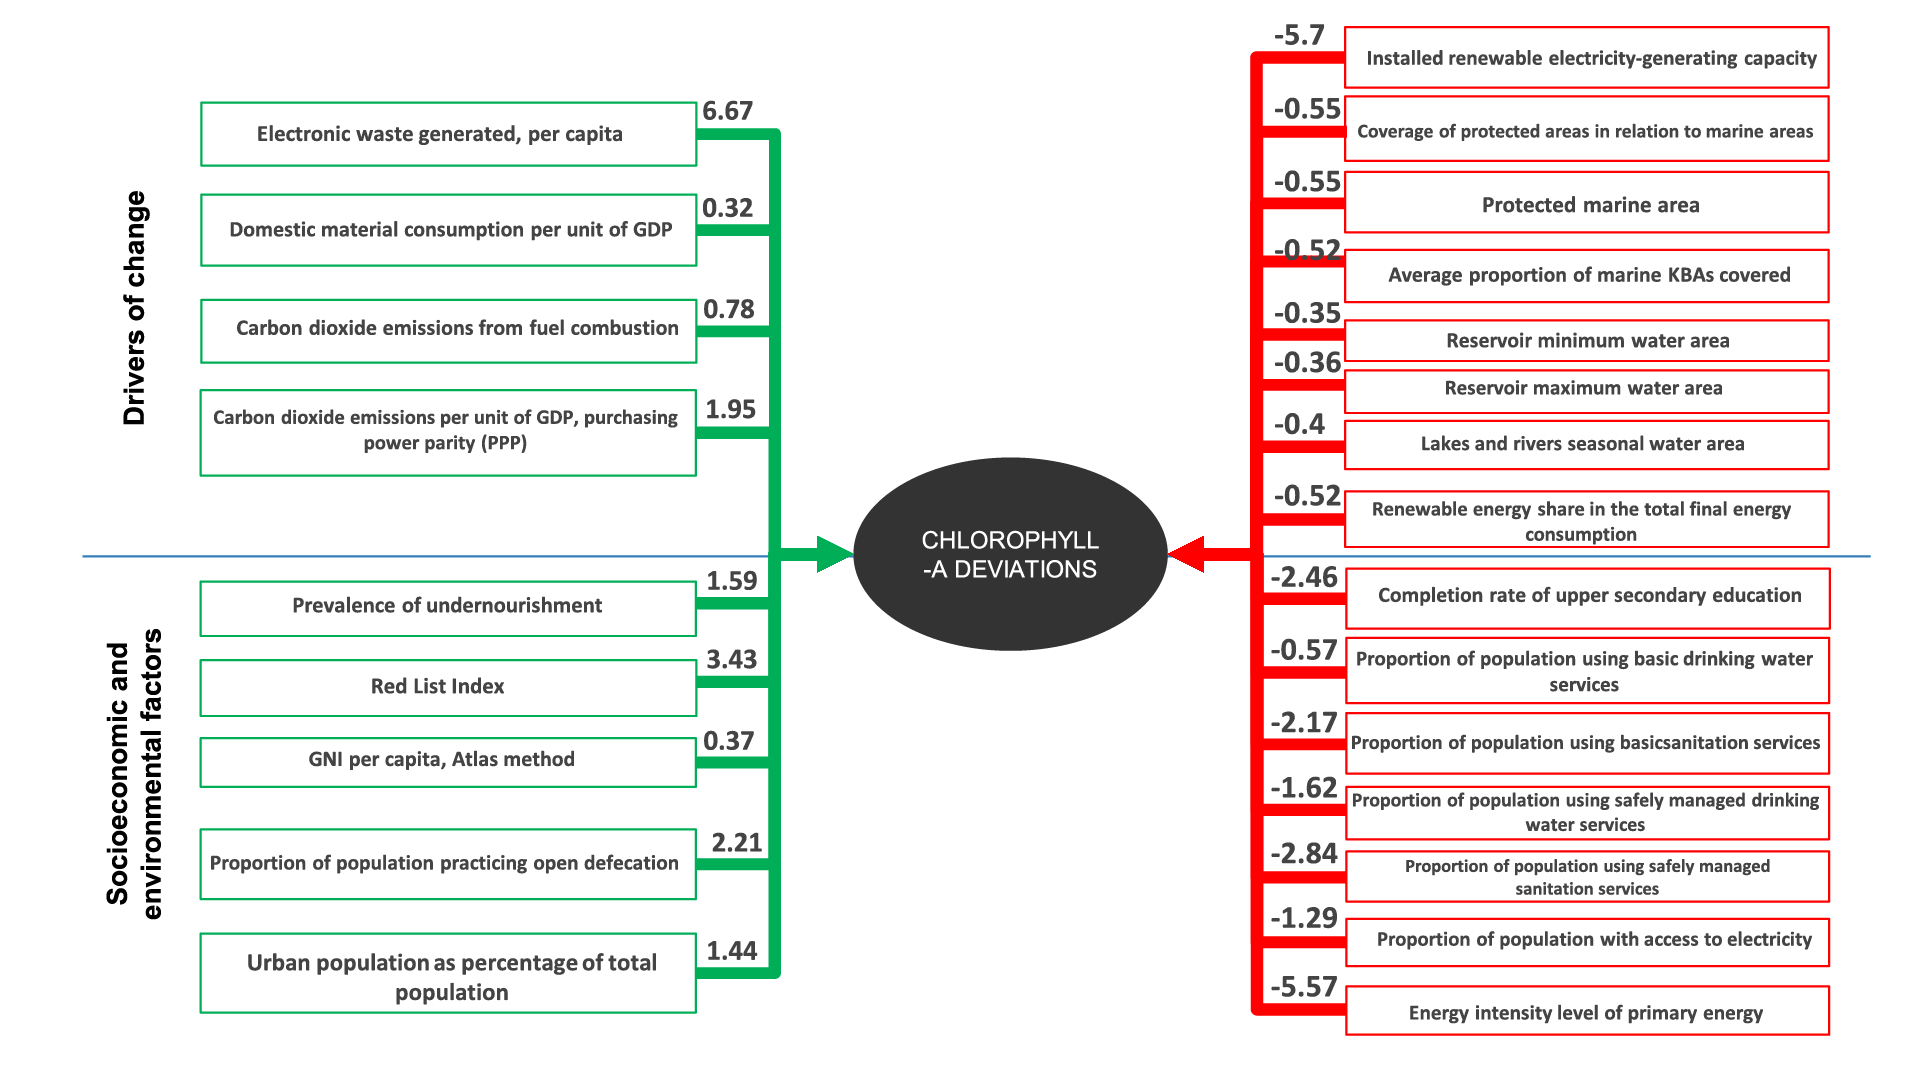
Figure 5.1 General model for chlorophyll-a deviations, global
For instance, nutrients dissolved or suspended as particulate
matter in freshwater streams and rivers eventually make their way to coastal and estuarine environments. In cases where
the natural water flow is disrupted by building dams, canals for
irrigation or other water management systems, then the natural
timing of delivery, composition and concentration of water and
nutrients can be perturbed. Under natural conditions, nutrients
such as carbon, nitrogen, phosphorus and silicon are transported
along the river and to the sea. Building a dam slows the water
flow down and results in the nutrients being used within the dam
reservoir by algae and aquatic plants, transforming dissolved
nutrients into particulate matter (sediments). The dam reservoir
may itself become eutrophic if the nutrient load is too high (Li et al.
2011). In such situations, the dam may be beneficial to the marine
downstream environment, since the excess nutrients have been
turned into sediment stored in the dam reservoir.
However, the reservoir may also promote chemical transformation
of dissolved nutrients such that, once released, the river may
promote eutrophication once it reaches the sea (Maavara et al.
2020). This can occur in cases where the ratios of the limiting
nutrient received by the marine environment are altered by the
upstream reservoir. The ratio of different nutrients (mainly nitrogen,
phosphorus and silicon) affects different groups of species. In
many marine environments it is silicon, not nitrogen, that limits the
growth of diatoms. So, if the reservoir results in the preferential
removal of silicon, the result can favour the growth of toxic algae
downstream (species that are not dependent on silicon (Howarth
and Marino 2006)).
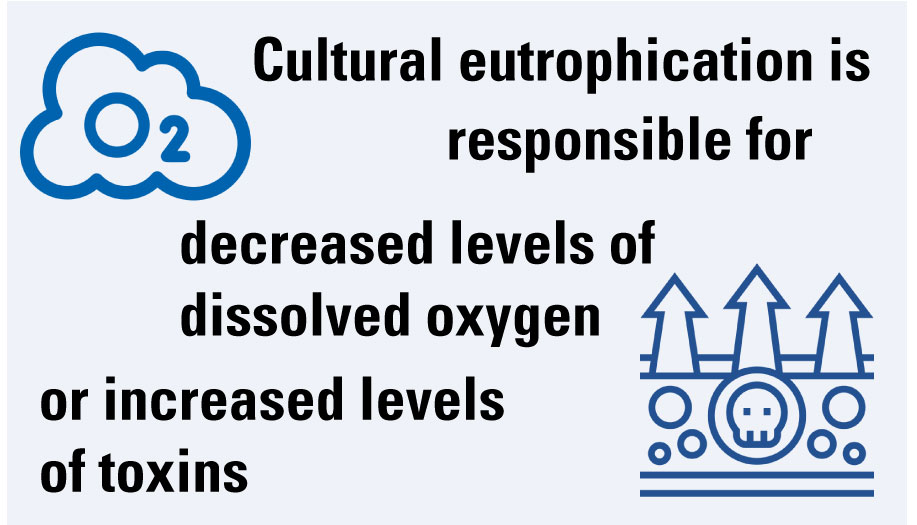
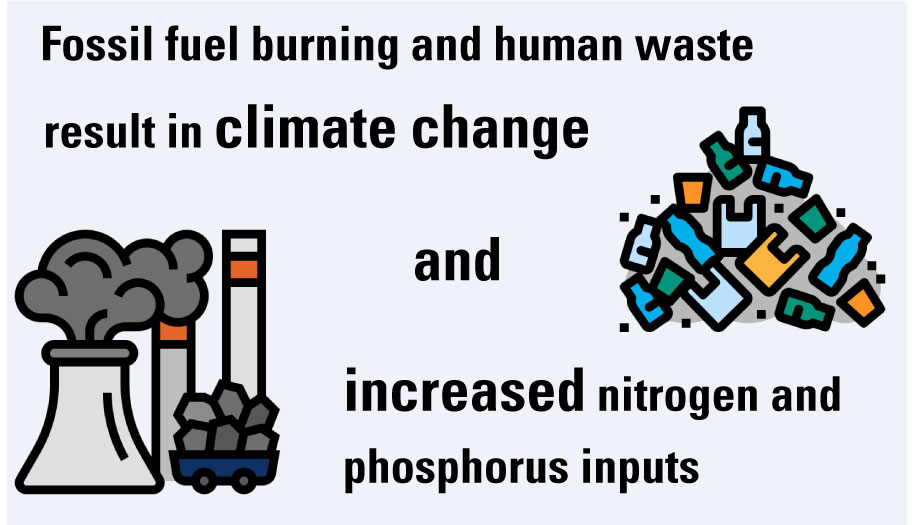
A common feature of many coastal systems experiencing hypoxia
is an elevated supply of organic matter, either through direct input
from external sources (e.g. sewage) or internal photosynthetic
production stimulated by inorganic nutrients, often stemming from
anthropogenic sources. Human population growth is commonly
associated with an increased intensity and/or frequency of coastal
eutrophication and formation of dead zones. People are attracted
to live in coastal settings, and as a consequence, inputs from
sewage treatment plants, household septic systems and urban runoff
increase (Tuholske et al. 2021).
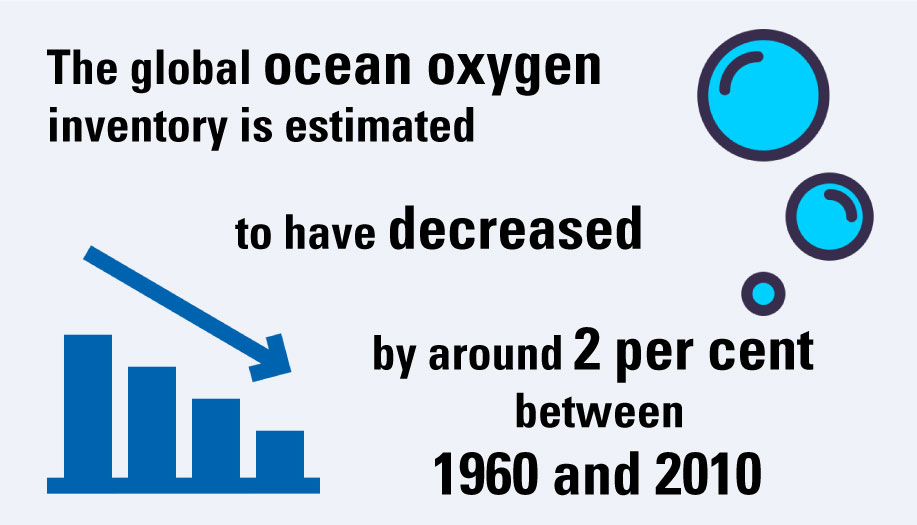
The Second World Ocean Assessment acknowledges a link
between excessive nutrient loads from sewage discharge and the
reduction of oxygen content in the water (hypoxia), causing loss
in marine life and the destruction of habitats and ecosystems
(UN 2021b). For instance, in South Africa, the state of municipal
wastewater and sewage treatment management has deteriorated
in recent decades, leading to coastal eutrophication becoming an
increasingly common problem. Adams et al. (2020) note that half
of the country’s estuaries are now affected by nutrient pollution
resulting in hypoxia, fish death and a loss of ecosystem services.
In China, Wang et al. (2008) described two phases of growth in
the occurrence of eutrophication in coastal estuaries, with one
phase of slow development from the 1970s to the 1990s and a
fast development phase after 2000. Eutrophication is considered
the key stimulus in the occurrence of harmful algal blooms, which
cause economic loss and human health issues (Wang et al.
2008). It is often difficult to determine which source of nutrients
is most responsible for the onset of eutrophication, as most
regions are susceptible to outflows of combinations of sewage
and wastewater, industrial discharges, farm effluents (including
aquaculture) and fertilizer washed into rivers and streams from
farmland. However, Ke et al. (2020) used isotopes of carbon and
nitrogen to identify that sewage from urban rivers was the major
pollution source in Jiaozhou Bay in northern China. Globally,
sewage and wastewater are estimated to contribute an amount
of nitrogen that is equal to about 40 per cent of the amount from
agriculture (Tuholske et al. 2021). This reflects the results of the
statistical analysis that indicate that an increase in sanitation use
corresponds to a decrease in chlorophyll-a deviation. Conversely,
the increase in practising open defecation corresponds to an
increase in chlorophyll-a deviation (SDG 14.1.1a).
In the coastal zone of the Baltic Sea, around 35 per cent of all
coastal ecosystems have experienced hypoxia between 1955 and
2009 (Conley et al. 2009), with the overall frequency of hypoxia
increasing. Terrestrial-derived organic carbon that is not derived
from sewage treatment plants plays only a minor role in the
Stockholm archipelago, for example, because no major rivers
discharge into the system, and surface rainwater run-off is low
(Sawicka and Brüchert 2017), meaning that nearly all of the excess
nutrient load is attributed to sewage outflow. The environment
was improved and hypoxic conditions reduced after the sewage
treatment was upgraded in the inner Stockholm Archipelago
(Norkko et al. 2012), but the problem persists.
The results of the statistical analysis suggest that an increase
in access to electricity (SDG 7.1.1), renewable share of energy
in the total final energy consumption (SDG 7.2.1) and installed
renewable energy-generating capacity (SDG 7.b.1) would imply a
decrease in chlorophyll-a deviations (SDG 14.1.1a), which favours
a non-eutrophic state for the marine environment. The previously
conducted research in this area tends to favour similar results.
Renewable energy sources are being considered as alternative
sources of energy, as fossil fuel sources are linked to the increase
in greenhouse gas emissions and climate change (UN 2021b).
Renewable energy sources can be land based, e.g. solar and
geothermal energies, as well as marine (marine renewable energy
[MRE]), e.g. offshore wind energy, marine biomass energy, salinity
and thermal gradient energy, wave energy, and tidal and ocean
current energy. There are emerging MRE sources: (a) offshore solar
energy based on floating solar systems, which are considered as
potential alternatives to the solar industry and are more efficient
than land-based solar systems, and (b) ocean floor geothermal
energy, which is still in its conceptual stages (UN 2021b).
Although MRE contributes to the reduction of greenhouse gas
emissions, water pollution, particulate matter, waste products and
climate change mitigation, its full environmental impact requires
further study (UN 2021b). Environmental impact assessments are
needed at the project level to better understand the interactions
among the environmental stressors introduced by installations and
minimize their negative impact on the physical environment (UN
2021b). For instance, 399 offshore wind turbines were installed
in the Belgian side of the North Sea by the end of 2020. A 10-year
monitoring programme was in place to monitor the construction
and operational phases of the farms from an environmental
perspective. It has shown that the exclusion of fisheries from the
wind farms coupled with increased food availability next to the
turbines has served as a refuge for some fish species and the
reef effect created by the turbines’ foundations attracted sea floor
communities, including worms, shellfish, crustaceans and starfish
(Moreau 2020). The increased availability of fish species next
to wind farms implies the weak potential of eutrophication and
favours a balanced marine environment in close proximity.
The results of the statistical analysis showed a positive relationship
between the proportion of urban population as percentage of
total population and chlorophyll-a deviations (SDG 14.1.1a). Urban
populations have been increasing for years. In 2018, around 55 per
cent of the world’s population was estimated to live in urban areas
and is expected to rise to 68 per cent by 2050 (UNDESA 2018).
In addition, in 2017, 2.4 billion people were estimated to live in
areas within 100 km of a coast (UN 2017). On the other hand, only
around 16 per cent of global coastal regions are ecologically intact,
while 48 per cent are heavily affected by human activities and 84
per cent of countries saw more than 50 per cent of their coastal
regions degraded (Williams et al. 2022). Degraded ecosystems do
not impact everyone equally. Adverse impacts are felt by groups
based on their gender and socioeconomic status. These vulnerable
populations face significant hardships that may have been caused
by others who are more economically empowered.
Effluents from large cities are entering large riverine inputs
of freshwater, nutrients and organic matter, causing heavy
eutrophication in tropical coastal areas (Canadell et al. 2021). The
global urban discharge of nutrients into surface water increased
about 3.5- to 4.5-fold during the twentieth century because of
wastewater discharge, land-use change and fertilizer consumption
(Kroeze et al. 2013). Depending on the distance between urban
discharges and coastal zones, such urbanized areas could cause
the high nutrient levels to be transported into the sea or ocean and
cause coastal eutrophication (Kroeze et al. 2013).
The statistical analysis has identified relationships between
chlorophyll-a deviations (SDG 14.1.1a) and several indicators:
SDG 12.4.2 on electronic waste generated per capita, SDG
8.4.2/12.2.2 on domestic material consumption per unit of GDP,
SDG 2.1.1 on prevalence of undernourishment, SDG 15.5.1 on Red
List Index, SDG 4.1.2 on the completion rate of upper secondary
education, SDG 6.1.1 on proportion of population using safely
managed drinking water services, SDG 7.3.1 on energy intensity
level of primary energy and GNI per capita. As per the experts’
opinions and extensive literature review, there was no information
to explain the relationship between chlorophyll-a deviations and
these indicators. For instance, the statistical analysis showed a
positive impact relationship between chlorophyll-a and SDG 9.4.1
on CO2 emissions per unit of value added. Although the literature
indicates a relationship between CO2 as a greenhouse gas and
ocean acidification, there is no research around the impact of CO2
emissions on eutrophication or chlorophyll-a deviations.
5.3 Sri Lanka: Interlinkages analysis of marine-related indicators at the national level
Map 5.3 Official map of Sri Lanka, (United Nations, 2022)
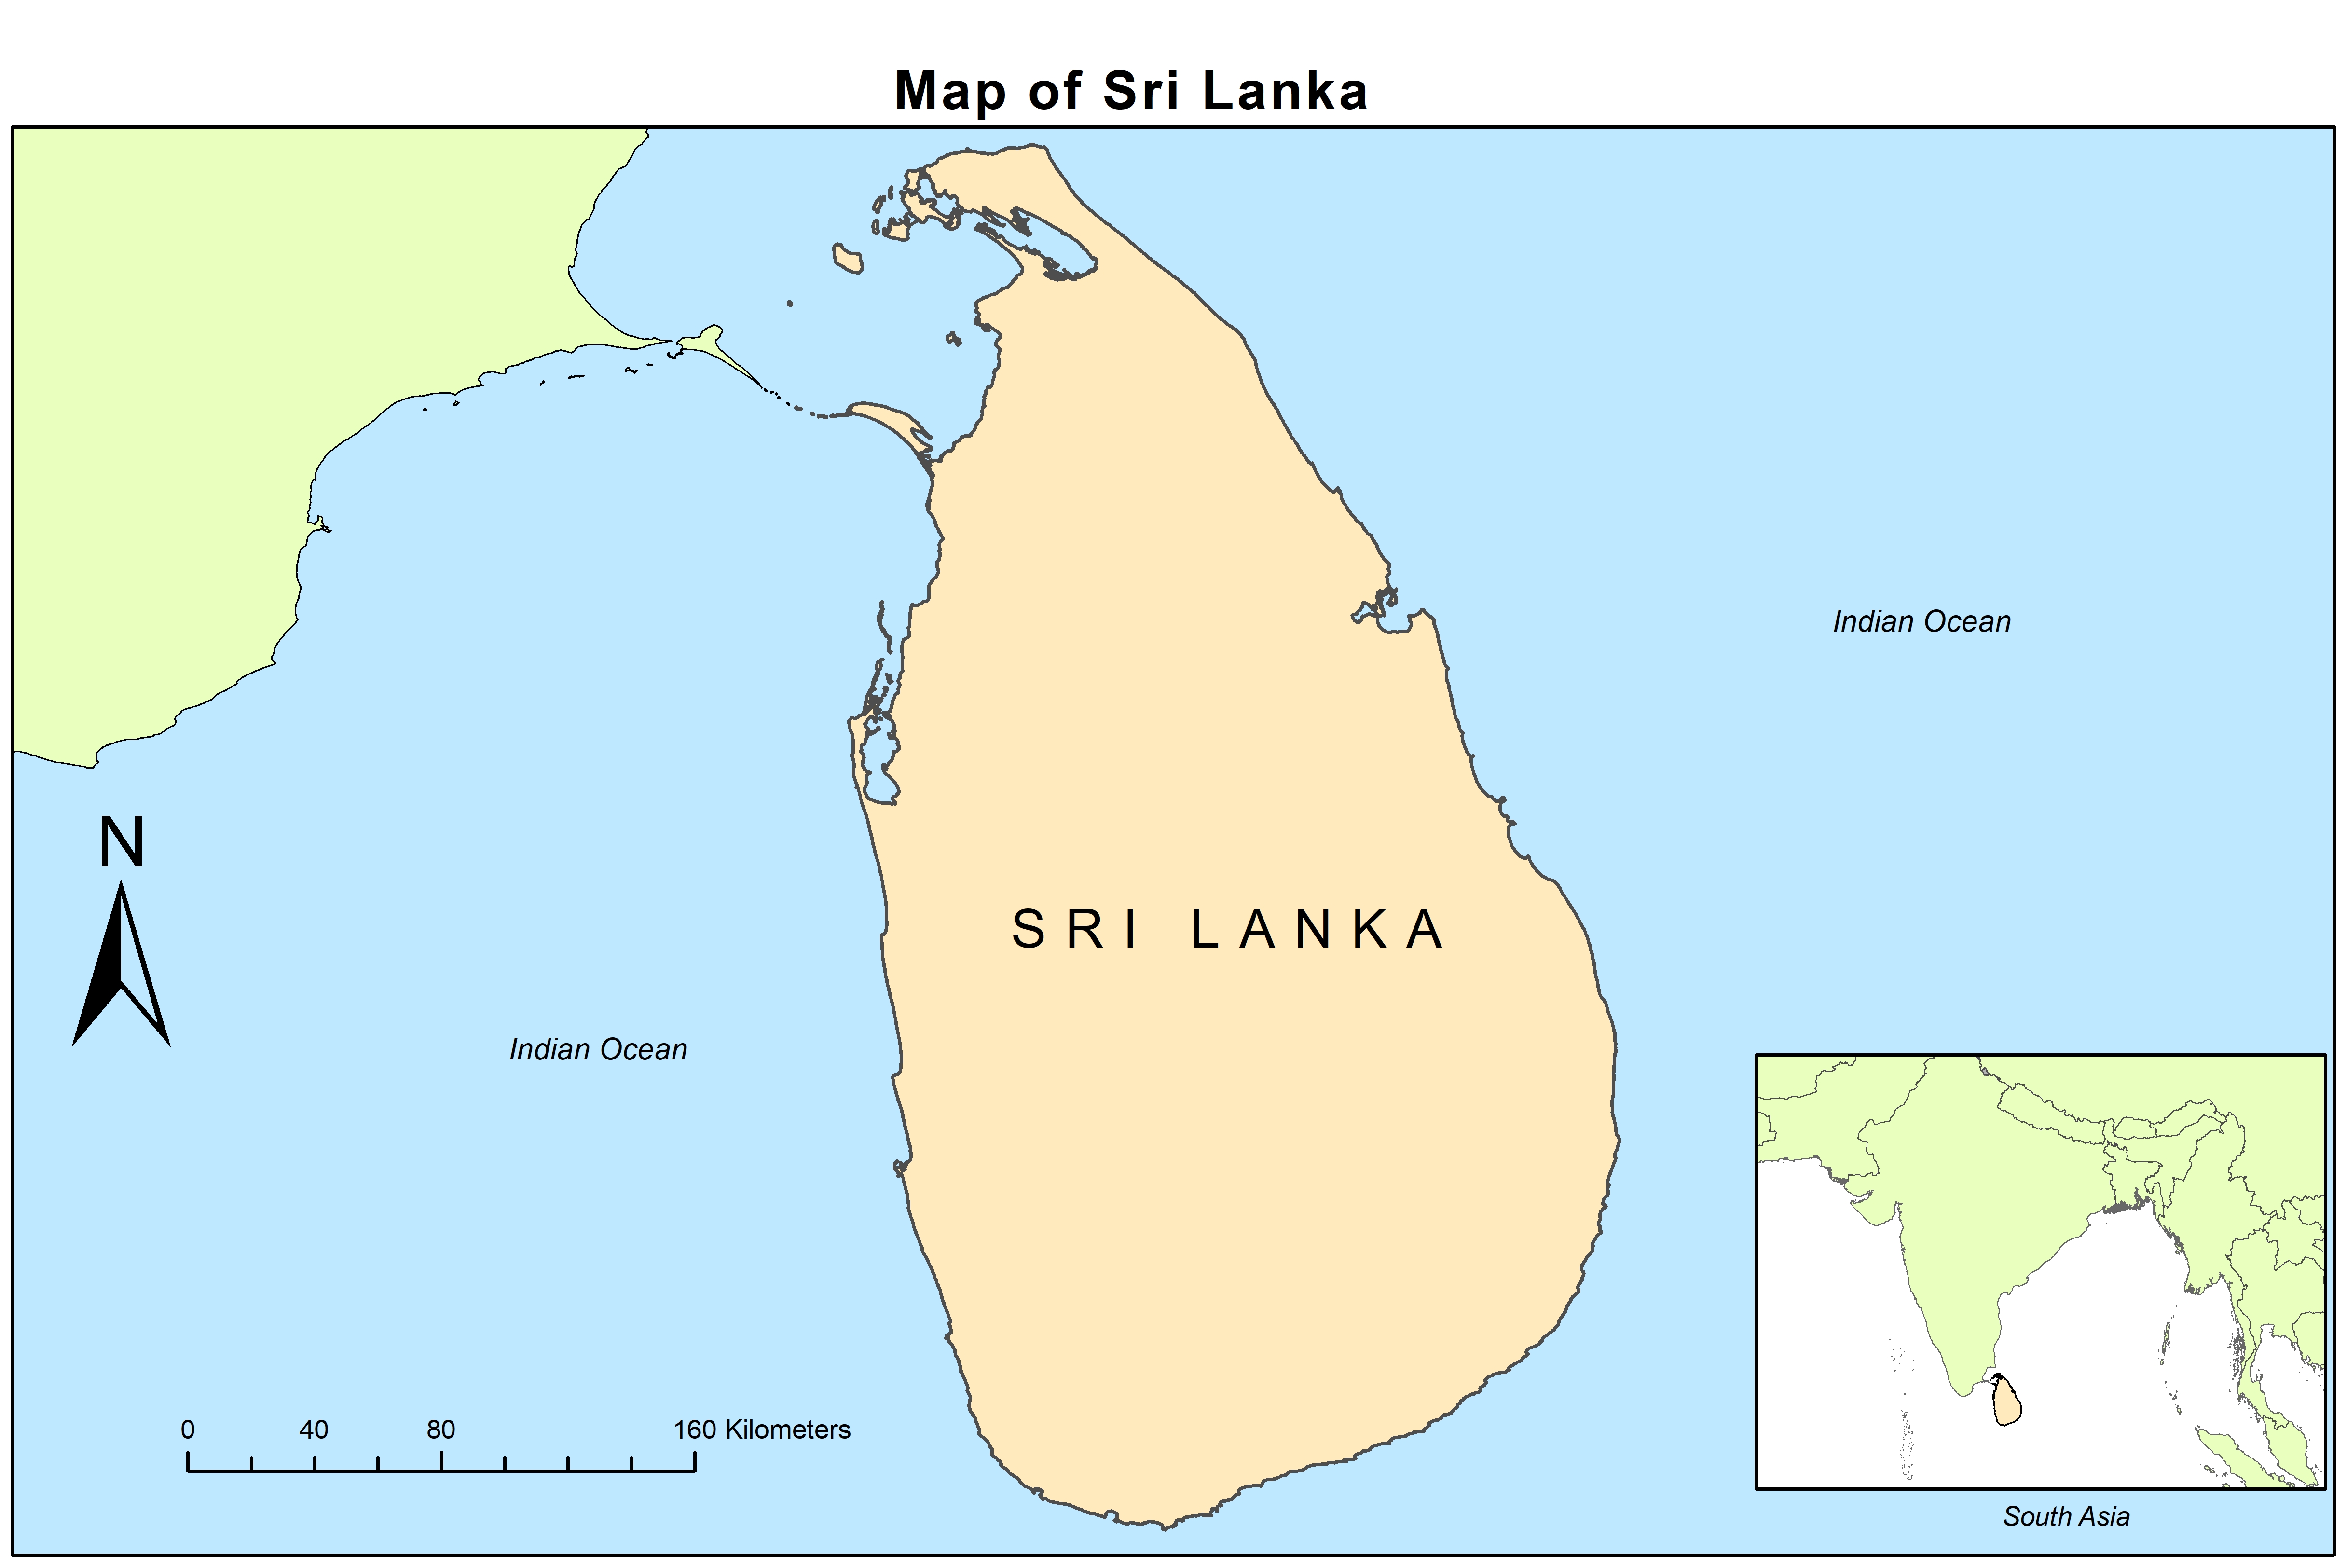
Overall, the sector supports around 1 million fishers, workers and their families, and the annual per capita consumption of fish ranges from 12 to 15 kg annually (Herath et al. 2019), constituting around 50 per cent of the annual per capita animal protein intake (WB n.d.). It is therefore essential for the country to safeguard its water environments and increase resilience of interlinked social and ecological systems from any humaninduced or naturally occurring stressors. Environmental depletion and climate-induced changes increase the pressure on women’s time, income, health, nutrition and social support systems in Sri Lanka (UNESCAP 2017). Women in Sri Lanka may face additional barriers to participating in decision-making processes related to the environment and natural resources, which limit their ability to advocate for their own needs and the needs of their communities (UN WOMEN 2022b).
In the context of this report, three marine indicators were identified from the SDG indicator framework to describe the state of the country’s marine-related ecosystems (see Annex D, table D.3), with only SDG indicator 14.1.1a on index of coastal eutrophication having sufficient data availability.
Many sub-indicators (more than 100) were considered for analysing the potential relationships on a national level that may impact the levels of coastal eutrophication in a positive or negative way, and secondary relationships between the state of marine-related ecosystems and their impact on human well-being indicators. A total of 18 sub-indicators (10 indicators as drivers of change, one indicator as state of marine-related ecosystems and seven indicators as socioeconomic and environmental factors) were eventually included in the primary analysis of drivers of change for Sri Lanka, and nine indicators for the secondary analysis on the state of human well-being (one indicator as state of marine-related ecosystems, one indicator as state of human well-being and seven socioeconomic and environmental factors), as the rest of the indicators did not fit the minimum requirements for the analysis. As a result, there was no statistically significant relationships identified by the statistical model.
There are several reasons that could explain the non-existence of statistically significant results by the current model. One relates to the availability of data at the national level. The resulting indicators of the available data may not correspond to the factors that actually impact the state of marine-related ecosystems in Sri Lanka, nor the state of human well-being. In addition, there might be a need for additional research that includes more in-depth and fine-grained information on Sri Lanka’s national context to be able to capture statistically significant results for marine-related ecosystems in Sri Lanka.