
2. The state of the environment

2.1 Global and regional progress on the environmental dimension of the SDGs
2.1.1 Global progress on the environmental dimension of the SDGs
Global analysis of the progress of the 92 environment-related SDG indicators indicates an improvement in data availability. Improvement in data availability is based on additional data being reported by countries, which leads to the availability of sufficient data to aggregate at regional and global levels. Compared with the Measuring Progress: Environment and the SDGs report (UNEP 2021b), the indicators with no data or insufficient data to analyse decreased from 58 to 41 per cent (Figure 2.1). Among SDG environment-related indicators, 38 per cent show positive change indicating environmental improvement, an increase from 28 per cent reported in the previous report (UNEP 2021b). In parallel, 21 per cent of SDG environment-related indicators are showing negative or little change – an increase from 14 per cent reported in 2020.
Figure 2.1 Global scorecard on the environmental dimension of the SDGs
Click on the Goal to see related environmental indicators and their progress.
To go back, click again on the Goal (circle).
Hover on indicators to see their names
Note: The environmental dimension is not represented in Goal 10 and Goal 16
● Positive change
● Little change
● Negative change
● Some data
● No data
The number of SDG indicators considered environment-related vary across goals, as does the availability of data at the goal level, except for SDG 10 on reduced inequalities and SDG 16 on peace and justice, which have no environment-related indicators. SDG 4 on education and SDG 5 on gender show no improvement in data availability since 2018, although these two goals each only have one SDG indicator. For SDG 5, data are available for 36 countries and cover the 2009–2020 period (UN 2022b); yet the total number of countries where data are available does not allow for a global aggregate. Such data gaps mean that countries collecting data on the gender-environment nexus may not have a standardized methodology and approach, thus making it difficult to track progress. In addition, SDG 3 on health and SDG 17 on partnerships and means of implementation indicate data availability, yet no progress in data availability was made between 2018 and 2022.
Significant improvements in data availability are recorded for SDG 6 on water, SDG 12 on sustainable consumption and production, SDG 14 on oceans and SDG 15 on land and biodiversity. Each goal has many indicators considered environment-related and data availability has improved since 2018 for several indicators. In 2022, SDG 6 on water has only one indicator with no data out of 11, SDG 12 on sustainable consumption and production has four indicators with no data out of 14, SDG 14 on oceans has two indicators with no data out of nine and SDG 15 on land and biodiversity has three indicators with no data out of 14 (Figure 2.2).
Figure 2.2 Data availability for environment-related SDG indicators per goal, 2018 to 2022
● Positive trend ● Little change or a negative trend ● No data or insufficient data
2.1.1.1 Freshwater- and marine-related ecosystems
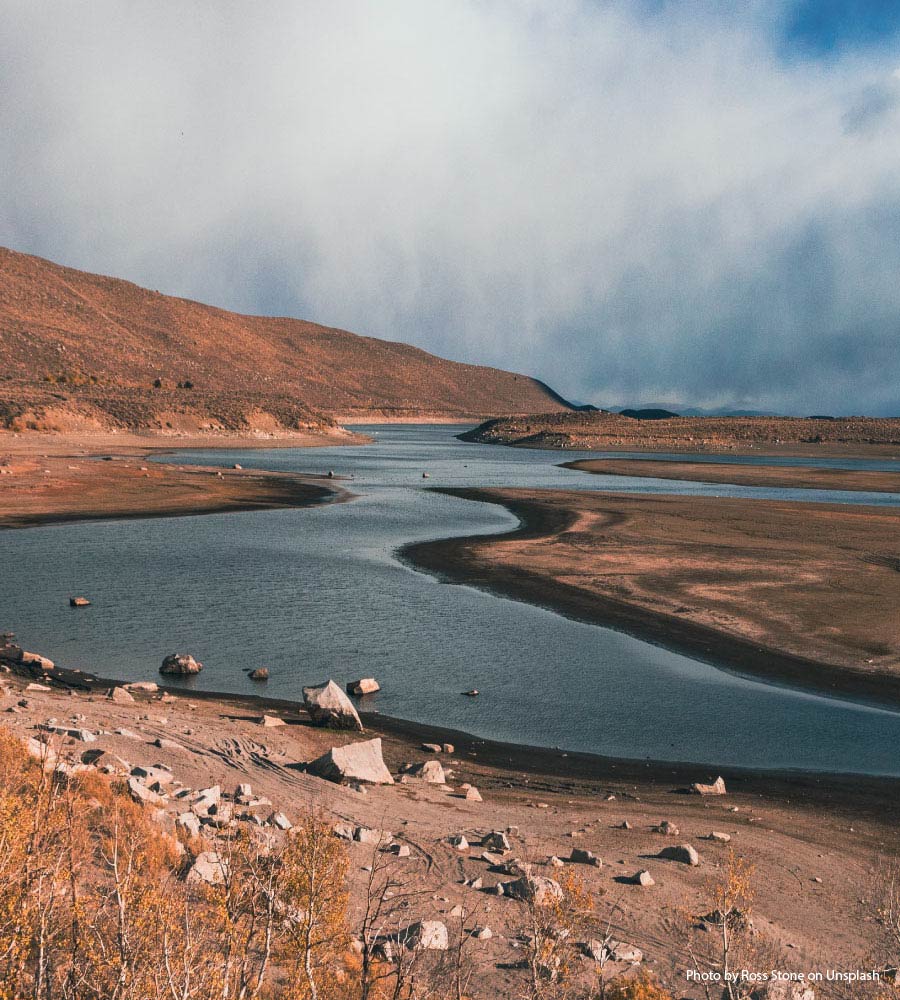
“The world’s water-related ecosystems are being degraded at an alarming rate”, is one of the main messages of the Sustainable Development Goals Report 2022 (UN 2022b). The latest data indicate a loss of 85 per cent of wetlands over the past 300 years, with rivers, lakes and reservoirs witnessing rapid change, due to many factors, of which the most profound is climate change (UN 2022b). Transboundary waters covered by operational arrangements have increased, yet “only 25 per cent of countries have more than 90 per cent of their transboundary waters covered by operational arrangements” (UN 2022b). Globally, 56 per cent of household wastewater was safely treated, leaving significant quantities of untreated wastewater discharged into water bodies causing eutrophication (UN-Habitat and WHO 2021).
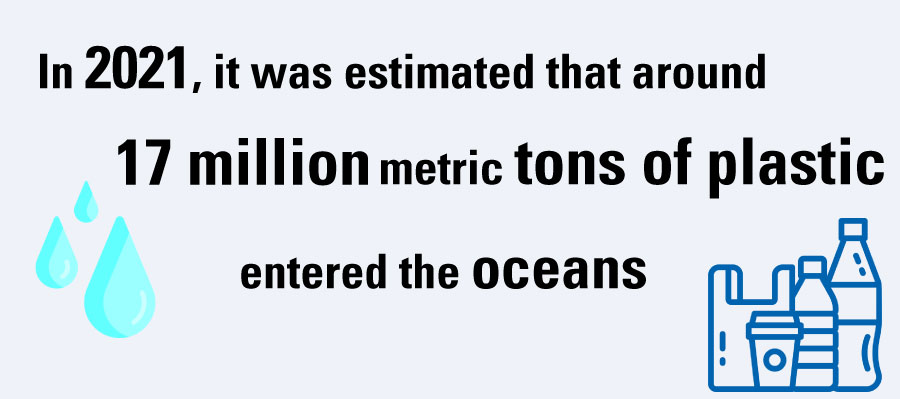
Marine-related ecosystems are facing continuous stress, with oceans and seas being endangered by increased plastic pollution, water temperature warming, eutrophication, acidification and overfishing. In 2021, it was estimated that around 17 million metric tons of plastic entered the oceans (UNSD 2022b), while the proportion of fish stocks within biologically sustainable levels is decreasing, with a slower rate of decline over the past decade (FAO 2022a). Countries have, however, progressed with implementing international instruments to combat illegal, unreported and unregulated fishing instruments (FAO 2022a).
2.1.1.2 Data availability and indicators’ progress
There are 22 water-related SDG indicators which include 13 freshwater-related indicators and nine marine-related indicators. Out of these 22 indicators, 50 per cent are exhibiting a positive change, indicating environmental improvement. However, 27 per cent of the indicators are exhibiting little or negative change, while 23 per cent are considered to have no data or insufficient data to analyse. A deeper look into freshwater-related indicators reveals that there is no indicator without data. Of the freshwater-related indicators, 62 per cent show positive change, 23 per cent indicate little or negative change and 15 per cent have insufficient data to analyse. Marine-related indicators are spread equally between positive change, little or negative change and no data or insufficient data to analyse at 33 per cent each.
2.1.1.3 Water-related ecosystem conservation policies and accelerated action as part of the United Nations Water Action Decade and United Nations Decade of Ocean Science for Sustainable Development
On 21 December 2016, the General Assembly declared 2018– 2018 as the International Decade for “Water for Sustainable Development” with the aim of accelerating efforts towards meeting the water-related targets of sustainable development and promoting the integrated management of water resources to attain social, economic and environmental objectives (United Nations General Assembly [UNGA] 2017a). The Decade also promotes cooperation, partnership and action by different actors at all levels and aims to stimulate the implementation of existing programmes and projects. It specifically calls for the closing of gender gaps in the water sector while stressing the importance of the full involvement of women, local communities, Indigenous peoples and other vulnerable groups in the implementation of the Decade at all levels (UNGA 2016). To guide those endeavours, UN-Water has developed an action plan for the Decade. This action plan includes four work streams: (a) facilitating access to knowledge and the exchange of good practices; (b) improving knowledge generation and dissemination, including new information relevant to water-related SDGs; (c) pursuing advocacy, networking and promoting partnerships and action; and (d) strengthening communication actions for implementation of the water-related goals. Many activities are planned to reach the objectives of the four working streams (UN-Water 2018b), and a midterm review of the Water Action Decade is planned for March 2023. Forty-three countries have pledged commitments and activities as part of the International Decade for Action (UN-Water n.d.).
On 5 December 2017, the General Assembly declared 2021– 2030 as the United Nations Decade of Ocean Science for Sustainable Development and called upon the Intergovernmental Oceanographic Commission of UNESCO to develop the Ocean Decade’s implementation plan (UNGA 2018). The “science we need for the ocean we want” vision is complemented by the Ocean Decade’s mission to motivate transformation solutions for sustainable development by setting the target to achieve seven outcomes: clean, healthy and resilient, productive, predicted, safe, accessible, and inspiring and engaging oceans (UNESCO-IOC 2021). These outcomes can be achieved through 10 identified Ocean Decade Challenges, which promote collective action at global, regional, national and subnational levels (UNESCO-IOC 2021). Although the Ocean Decade will not focus on policy, it “will build scientific capacity to generate knowledge that will directly contribute to the goals of the 2030 Agenda” (UNESCO-IOC 2021). As at May 2022, the Ocean Decade Actions enlisted 31 global programmes, 92 projects, 15 United Nations-led actions, 42 contributions and 277 activities across more than 40 countries. In addition, resource mobilization of US$ 844 million has been secured (UNESCO-IOC 2022a).
On 1 March 2019, the General Assembly declared 2021–2030 as the Decade on Ecosystem Restoration, calling to conserve and restore all ecosystems on Earth, which include freshwater- and marine-related ecosystems (UNEP-FAO 2020).
2.1.2 Sub-Saharan Africa: Regional progress on the environmental dimension and state of the environment indicators of the SDGs
Figure 2.3 Scorecard on the environmental dimension of the SDGs in sub-Saharan Africa
Click on the Goal to see related environmental indicators and their progress.
To go back, click again on the Goal (circle).
Hover on indicators to see their names
Note: The environmental dimension is not represented in Goal 10 and Goal 16
● Positive change
● Little change
● Negative change
● Some data
● No data
2.1.2.1 Freshwater- and marine-related ecosystems in sub-Saharan Africa
Sub-Saharan Africa consists of several terrestrial and aquatic biomes ranging from large and small freshwater rivers and lakes, including their headwaters and deltas to wetland ecosystems such as swamps, bogs and salt marshes (Wilson and Primack 2019) as well as several marine biomes. In the region, growing pressures and threats on water resources are mostly a build-up of rapidly shifting demographic trends (UNDESA 2022a), coupled with a significant number of countries having water scarcity, as well as adding the adverse impacts of climate change (Trisos et al. 2022), biodiversity loss (IPBES 2018a), pollution and land degradation (Dangui and Jia 2022). For instance, Lake Chad, shared by Cameroon, Chad, Niger and Nigeria, has a basin covering almost 8 per cent of the continent. The water once served over 30 million people but has shrunk by 90 per cent since the 1960s, having detrimental effects on other forms of economic growth, natural capital and human security in the wider Sahelian parts of the continent (Usigbe 2019). Also, as large number of rivers are transboundary in nature, countries depend on water originating from outside their boundaries (World Bank [WB] 2021).
Water resources form the cornerstone of sustainable development, as SDGs 6 and 14 act as enablers of other goals and are simultaneously impacted by other goals. Estimates (African Development Bank [AfDB] Group 2022a) show that 75 per cent of the current and emerging jobs globally are moderately or highly dependent upon access to water and water-related services. Yet currently, water resources in sub-Saharan Africa are faced with a multitude of risks that threaten their security and the long-term water needs of the people, environment and economies. These threats have risen sharply in the last two years, owing to multiple stressors that have taken a toll on the region’s economies while drawing down on national budgetary resources (AfDB Group 2022a). The Water Strategy 2021–2025: Towards a Water Secure Africa (AfDB Group 2022b) shows that the average per capita water withdrawal in Africa is less than 40 per cent of the world’s average with only approximately 11 per cent of the hydropower potential utilized and around 6 per cent of cultivated land being irrigated despite the higher levels of irrigable potential[ 3 ] (AfDB Group 2022b). In addition, many countries are experiencing water stress, including Africa’s five of the global eight countries expected to receive over half of the projected increase in global population by 2050 (UNDESA 2022a). Among them are countries that are experiencing constraints with either water stress and/or water supply infrastructural capacity, including the Democratic Republic of the Congo, Ethiopia, Nigeria and the United Republic of Tanzania.
In 2022, for example, the eastern and horn of Africa subregion experienced its worst drought in 40 years. Drier-thanaverage conditions have been predicted to become more frequent and severe (Office for the Coordination of Humanitarian Affairs [OCHA] 2022).
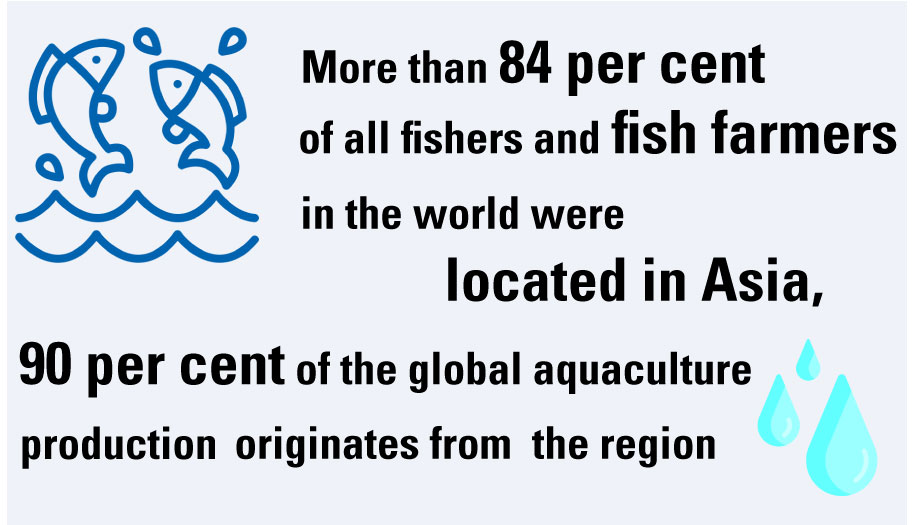
Among sub-Saharan Africa’s 50 countries, 31 are coastal and/ or island States (Ngoile 1997). These countries are rich in various and diversified ecosystems, including lagoons, deltas, mountains, wetlands, mangroves, coral reefs and shelf zones. These ecosystems sustain considerable amounts of fisheries and water resources, which in turn support livelihoods and economies. In 2020, the coastal population (100 kilometres [km] of the coast) of sub-Saharan Africa was estimated at nearly 60 million people (United Nations n.d.). Since 2000, employment in fisheries and aquaculture in Africa rose from 3.6 million people to 5.6 million people in 2020, an increase of more than 50 per cent with 10 per cent of all existing fishers located in the continent (FAO 2022b). Rapid coastal population growth and urbanization coupled with limited financial resources are continuing to exacerbate the existing constraints that include overfishing, marine pollution and loss of natural habitats. Additionally, climate change-induced sea level rise increases vulnerabilities of low-lying lagoon zones, coastal settlements and other productive areas with subsequent pressure on carrying capacity of the concomitant resources. The resultant impacts of these situations include intensified competition to access and control the shrinking resources thus increasing tension in communities, economies and natural habitats (United Nations n.d.).
2.1.2.2 Data availability and indicator progress
Data availability concerning the 92 environment-related SDG indicators in the sub-Saharan Africa region has improved, where no data or insufficient data to analyse decreased from 65 per cent in 2020 to 51 per cent in 2022 (Figure 2.3). Environment-related indicators showing environmental improvement increased from 24 per cent in 2020 to 32 per cent in 2022, while environment-related SDG indicators showing environmental deterioration increased from 11 per cent to 17 per cent (Figure 2.4).
A total of 45 per cent of sub-Saharan Africa’s water-related indicators show positive change, 18 per cent indicate a negative change and 36 per cent have no data or insufficient data to analyse the progress – a decrease from 64 per cent compared with the previous report (UNEP 2021b). Within the freshwater-related SDG indicators, 62 per cent indicate positive change towards environmental improvement, while 15 per cent show environmental deterioration and 23 per cent have no data or insufficient data to analyse – compared with 46 per cent in 2020 (UNEP 2021b). However, 56 per cent of marine-related SDG indicators have no data or insufficient data to analyse – compared with 89 per cent in 2020 (UNEP 2021b), while positive and negative change indicators represent 22 per cent each.
Figure 2.4 Environment-related SDG indicators data trend, sub- Saharan Africa
● Positive trend ● Little change or a negative trend ● No data or insufficient data
2.1.2.3 Water-related ecosystem conservation policies and accelerated action as part of the United Nations Water Action Decade and United Nations Decade of Ocean Science for Sustainable Development
Cognizant of the prevailing bottlenecks that continue to hamper progress in the water components of the 2030 Agenda in Africa, the African Union’s Member States decided on collective policy response measures (GWP 2021) by adopting a continental Africa Water Investment Programme (AIP) and its SDG water investment support. The programme is led by national governments, regional economic communities and River Basin Organizations, with technical backstopping by the AIP Secretariat hosted by the Global Water Partnership Africa Coordination Unit. It seeks to transform the investment outlook for water and sanitation in Africa, by mobilizing US$ 30 billion in climate-resilient, gender-sensitive investments in water and sanitation by 2030, and creating 5 million jobs in Africa, as it recovers from the COVID-19 pandemic (UNEP 2021a). The AIP SDG water investment support programme fosters these goals by helping countries to achieve SDG 6 and waterrelated targets linked to health, energy, food and ecosystems. Such an integrated policy approach is timely and offers hope for progress in the region’s water sector including in the interlinked food systems and value chains, which are tied to various facets of the 2030 Agenda and SDGs.
Six countries in the sub-Saharan region submitted commitments to the Water Action Decade, thereby accounting for 14 per cent of all submissions. Within their country statements, officials from Cabo Verde, Ethiopia, Ghana, Namibia, Nigeria and South Africa uniformly emphasized the central position of SDG 6 within the SDG framework and the importance of adequate funding (UN-Water n.d.).
Successfully launched at the African Conference on Priority Setting and Partnership Development for the United Nations Decade of Ocean Science, the Ocean Decade Africa Roadmap provides a framework to coordinate ocean science planning and uptake. Based on extensive stakeholder engagement, the road map further defines nine priority Decade Actions which, among others, focus on sustainable ocean management, ocean observations and forecasting and regional ocean literacy (UNESCO-IOC 2022b).
Moreover, 14 per cent of all National Decade Committees originate from sub-Saharan Africa (UNESCO-IOC 2022a). The region was successful in contributing nine Decade projects (WIOMSA/IOCUNESCO 2022). In line with the Ocean Decade Africa Roadmap, these projects focused on establishing scientific institutions and networks related to ocean observations and monitoring as well as on educational activities to enhance ocean literacy (WIOMSA/IOCUNESCO 2022).
2.1.2.4 Remaining gaps
The infrastructure gap constitutes one of the main constraints to progress in Africa’s water resources sector. These include the infrastructure gaps in water supply as well as in the actions for curbing water pollution from land-based activities, which aggravate the impacts of climate change on water and water-related ecosystems. In addition, the hydrology of African surface water is poorly monitored (Papa et al. 2022), highlighting the need for better data availability and accessibility to reduce the data gap in the water sector in sub-Saharan Africa.
Vulnerability and slow progress in Africa’s water sector and waterrelated ecosystems and the interlinked value chains are mainly attributed to low investments that have persisted over time (UNEP 2021a). Between 2021 and 2022, long-term investments in water have been hugely crowded out by the urgent need for African countries to address immediate health-care demands and the disrupted food supply chains as a result of the COVID-19 pandemic and ongoing conflicts. This is despite the region being off-track in many of the targets of the 2030 Agenda and Africa’s Agenda 2063, in addition to the mounting triple planetary crisis of climate change, pollution and degradation of natural habitats, which continues to damage the region’s freshwater, marine and coastal ecosystems. Similar to other countries around the world, gender equality in the environment context has also dramatically suffered, further slowing down ambitions to promote and monitor gender equality and youth engagement in ocean science, which was one of the enablers adopted at the Ocean Decade Africa Roadmap (UNESCOIOC 2022c).
The African Economic Outlook 2022 (AfDB Group 2022a) shows the estimated cumulative financing needs for Africa to respond adequately to climate change, including adaptation in the water sector, ranging from about US$ 1.3 trillion to US$ 1.6 trillion in the lead -up to 2030 targets, which translates to about US$ 118.2– 145.5 billion annually, with Eastern Africa requiring the highest adaptation cost due to its susceptibility to climatic stresses, lower resilience and response readiness. Green bonds and other innovative financing mechanisms that align with the Addis Ababa Action Agenda on framework for financing sustainable development (UN 2015) represent potential opportunities for reducing the financial gaps of Africa’s water sector. Countries in sub-Saharan Africa have good prospects to leverage green finance due to the associated financing cost benefits that loans and equity investments do not offer (AfDB Group 2022a). This need to be complemented with a strengthened space for enabling policies including involving the private sector and other key stakeholders in water resource sustainability and access.
2.1.3 Asia and the Pacific: Regional progress on the environmental dimension and state of the environment indicators of the SDGs
Figure 2.5 Scorecard on the environmental dimension of the SDGs in Central and Southern Asia
Click on the Goal to see related environmental indicators and their progress.
To go back, click again on the Goal (circle).
Hover on indicators to see their names
Note: The environmental dimension is not represented in Goal 10 and Goal 16
● Positive change
● Little change
● Negative change
● Some data
● No data
Figure 2.6 Scorecard on the environmental dimension of the SDGs in Eastern and South-Eastern Asia
Click on the Goal to see related environmental indicators and their progress.
To go back, click again on the Goal (circle).
Hover on indicators to see their names
Note: The environmental dimension is not represented in Goal 10 and Goal 16
● Positive change
● Little change
● Negative change
● Some data
● No data
Figure 2.7 Scorecard on the environmental dimension of the SDGs in Oceania
Click on the Goal to see related environmental indicators and their progress.
To go back, click again on the Goal (circle).
Hover on indicators to see their names
Note: The environmental dimension is not represented in Goal 10 and Goal 16
● Positive change
● Little change
● Negative change
● Some data
● No data
2.1.3.1 Freshwater- and marine-related ecosystems in Asia and the Pacific
The region of Asia and the Pacific encompasses the highest mountain range of the world, the deepest ocean floor, and some of the most extensive rivers and deltas in the world (IPBES 2018b). The region is home to about 55 per cent of the global population – approximately 4.4 billion people (UNDESA 2022a), with less than 30 per cent of the world’s internal renewable freshwater resources, hence making water availability per capita the lowest in the world (UNEP 2019a).
0
Per cent of Global Population
0
Billion people
0
Per cent of freshwater resources
The region has experienced a rapid urbanization, industrialization and agriculture advancement over the past 40 years. Its economic growth and social development have lifted hundreds of millions out of poverty, and enabled many to have prosperous, productive and healthier lives. Scientific analysis, however, shows the current approach to development in the region has a significant cost on health and the environment (UNEP 2016a). Water-related ecosystems and water resourcerelated issues are particularly acute in the region and exacerbated by climate change (UNEP 2008a; UNEP 2008b; UNEP 2009; UNEP 2011). During the period between June and August 2022, extreme water-related weather events happened in the region. On the one hand, torrential monsoon rains caused the most devastating flooding in Pakistan’s recent history, where at least one third of the country was under water and extreme flooding displaced some 33 million people and killed more than 1,200 (Mallapaty 2022). On the other hand, a record-breaking drought in China caused parts of the Yangtze River and its tributaries to dry up, an economically strategic basin serving more than 400 million people, disrupting hydropower, agriculture, shipping and factory production (Government of China 2022).
2.1.3.2 Data availability and indicator progress
Asia and the Pacific is not on track to achieve any of the SDGs (UNESCAP 2022), in part because of climate change and the COVID-19 pandemic. Despite such disruptions to the efforts of countries and local communities to implement and deliver the SDGs, there has been meaningful progress in environment-related data availability. For instance, the percentage of SDG environmentrelated indicators with unavailable data or insufficient data to analyse has decreased from 70 per cent in 2020 to 51 per cent in 2022 in the Central and Southern Asia subregion (Figure 2.5), decreased from 65 per cent in 2020 to 50 per cent in 2022 in the Eastern and South-Eastern Asia subregion (Figure 2.6) and from 64 per cent in 2020 to 54 per cent in 2022 in Oceania (Figure 2.7). The proportion of SDG environment-related indicators showing environmental improvement increased in the three subregions to 37 per cent for Central and Southern Asia, 28 per cent for Eastern and South-Eastern Asia and 25 per cent for Oceania in 2022. The proportion of indicators showing environmental degradation also increased from 7 per cent in 2020 to 12 per cent in 2022 for Central and Southern Asia, from 12 per cent in 2020 to 22 per cent in 2022 for Eastern and South-Eastern Asia, and from 11 per cent in 2020 to 21 per cent in 2022 for Oceania (Figure 2.8).
Figure 2.8 Environment-related SDG indicators data trend, Central and Southern Asia
● Positive trend ● Little change or a negative trend ● No data or insufficient data
Figure 2.8 Environment-related SDG indicators data trend, Eastern and South-Eastern Asia
● Positive trend ● Little change or a negative trend ● No data or insufficient data
Figure 2.8 Environment-related SDG indicators data trend, Oceania
● Positive trend ● Little change or a negative trend ● No data or insufficient data
In 2022, out of the 13 water-related SDG indicators, 46 per cent of indicators showcased an improvement in environmental conditions, while 8 per cent indicated environmental degradation and 46 per cent had no data or insufficient data to analyse. On marine and coastal ecosystem protection, the Pacific small island developing States and Eastern and South-Eastern Asian countries have made progress since 2009–2010 with the establishment of marine/coastal protected areas. The average proportion of marine Key Biodiversity Areas (KBAs) covered by protected areas (SDG 14.5.1) reached 39 per cent, 34 per cent and 27 per cent in Oceania, Eastern and South-Eastern Asia, and Central and Southern Asia, respectively. Yet, 6 out of 10 marine-related SDG targets (SDG 14) lack data to analyse.
2.1.3.3 Water-related ecosystem conservation policies and accelerated action as part of the United Nations Water Action Decade and United Nations Decade of Ocean Science for Sustainable Development
Major recent regional water policies in Asia and the Pacific include the Southern Asia Water Initiative (SAWI) and two strategies released by the Coordinating Body of the Seas of East Asia (COBSEA). During its project duration from 2013 to 2021, SAWI focused on establishing a neutral platform for regional cooperation concerning major Himalayan river systems in Southern Asia, a catchment area affecting more than one billion people across Afghanistan, Bangladesh, Bhutan, China, India, Nepal and Pakistan (WB 2022a). After completion of the initiative, the Southern Asia region continues to implement cross-border water and climate activities funded by the World Bank and other trust funds.
While SAWI provides a platform for joint policymaking on freshwater in Southern Asia, COBSEA focuses on collective policies regarding marine waters and integrates the interests of nine East Asian countries in its East Asian Seas Action Plan. Within its Strategic Directions 2018–2022, COBSEA delineates activities to prevent and reduce land-based marine pollution, enhance marine and coastal planning and management and create regional policy mechanisms for coastal and marine environments (COBSEA 2018). Beyond 2022, the Strategic Directions are being prepared to cover the 2023–2027 period. The Regional Action Plan on Marine Litter 2019 was developed to curb marine pollution by preventing and reducing marine litter from land- and sea-based sources. It also includes a pledge to establish a scientific marine litter monitoring group and outlines a set of future activities undertaken by COBSEA to support the successful implementation of the regional action plan (COBSEA 2019).
SAWI supported climate resilience and sustainable, fair, and inclusive development
Read more
Protecting our coastal and marine environment for a sustainable future
Read more
As part of the Water Action Decade, at the third Asia-Pacific Water Summit (2017) held in Yangon, Myanmar, 35 state representatives and non-governmental stakeholders unanimously adopted the Yangon Declaration: The Pathway Forward (APWS 2018). Hosted by the Asia-Pacific Water Forum (APWF), signatories of the Yangon Declaration pledged to take a leading role in the Water Action Decade. A central announcement was the promise to regionally double investments in activities that address water-related disasters and water security (APWF 2017; Ishiwatari and Surjan 2019). In 2022, the participating countries to the fourth Asia-Pacific Water Summit signed the Kumamoto Declaration, pledging to enhance their water sectors by improving governance structures, mobilizing investments and stimulating science and technology communities to provide innovative solutions to water-related problems (APWF 2022).
Water Security for Sustainable Development
Read more
To raise the priority of tackling water security issues
Read more
More than one quarter of all projects related to the Decade of Ocean Science originated from the Asia-Pacific region, and six National Decade Committees were established, namely Iran, India, Indonesia, Japan, the Republic of Korea and New Zealand (UNESCO-IOC 2022a). In 2020, UNESCAP adopted resolution 76/1 (UN-ESC 2020) on “Strengthening cooperation to promote the conservation and sustainable use of the oceans, seas and marine resources for sustainable development in Asia and the Pacific” and developed a Regional Decade Programme for the region in cooperation with other United Nations agencies to support the implementation of the Decade of Ocean Science (UNESCAP 2021a).
2.1.3.4 Remaining gaps
In both quality and quantity, water in Asia and the Pacific is under threat (ADB 2020a). Acute water issues are not only attributable (to a lesser extent) to an actual low quantity in general, but more to weak water governance in the region (OECD 2021). Therefore, bridging the gaps in integrated water resources management as policy framework in Asia-Pacific through more effective, genderresponsive governance and better management practices is essential. To address acute water issues, an integrated approach that embeds gender equality and human rights with tackling the interrelated triple planetary crisis is needed.
New and innovative water financing mechanisms with participation of development partners and private sector are still lacking in the region (ADB 2020a). It was not until recently (November 2022) that the Asian Development Bank announced US$ 200 million to support programmes targeting water and sanitation resilience in the region (ADB 2022). Countries need to invest in such water financing mechanisms through policy guidelines, financial support and market incentives. Effective engagement of development partners and the private sector in both development and implementation of the new water financing mechanisms is key to the successes and sustainability of the mechanisms.
Management practices in the region require enhancement (OECD 2021). Practices of special concern include accords on transboundary water bodies, as these agreements not only effectively govern shared water resources, but also act as platforms for water diplomacy (OECD 2021). Adding to such cooperation are regional cooperation mechanisms for the conservation of marine and coastal environments, for instance the Regional Seas Programme.
In addition, the lack of timely and credible water resource data across Asia and the Pacific is a key barrier to effective policymaking (OECD 2021; UNESCAP 2020). To address this challenge, countries need to improve water data availability and quality to support evidence-based policymaking.
2.1.4 Europe and Northern America: Regional progress on the environmental dimension and state of the environment indicators of the SDGs
Figure 2.9 Scorecard on the environmental dimension of the SDGs in Europe
Click on the Goal to see related environmental indicators and their progress.
To go back, click again on the Goal (circle).
Hover on indicators to see their names
Note: The environmental dimension is not represented in Goal 10 and Goal 16
● Positive change
● Little change
● Negative change
● Some data
● No data
2.1.4.1 Freshwater- and marine-related ecosystems in Europe
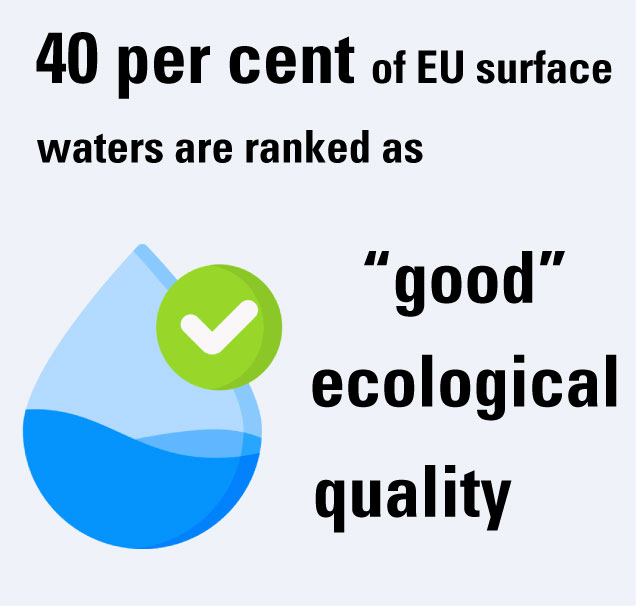
Europe hosts a diverse range of freshwater and marine biomes, including groundwater, lakes and rivers, transitional waters, coastal waters and territorial waters. In the region, around 92 per cent of countries have more than 80 per cent of their water bodies at “good ambient water quality” (UNSD 2022a; UNSD 2022b). Within the stricter definitions of the European Union (EU), the region has shown little overall improvement since measuring for the Water Framework Directive (WFD) commenced in 2009. Forty per cent of EU surface waters are ranked as “good” ecological quality according to the latest assessment report, released in 2015, well below the 2027 WFD goal of 100 per cent (European Environment Agency [EEA] 2021a). However, individual elements have improved across Europe in recent decades, such as recovery from acidification mostly due to reductions in sulfur emissions (NIVA 2020), with corresponding improvements in aquatic ecologies. Thirty-eight per cent of EU surface waters are ranked by WFD as having a “good” chemical status (EEA 2022). Overall, in the last decade, the industrial water discharged – including heavy metals, phosphorus and nitrogen – decreased as economic value increased, in accordance with EU industrial development plans. A state-level focus showcases discrepancies between countries, with some countries having increased water discharged with heavy metal contents by over 20 per cent compared with 2010 levels (EEA 2022). Water abstraction is currently decoupled from economic growth in Europe. Between 2000 and 2017, water abstraction decreased by 17 per cent while the total gross value added from all economic sectors increased by 59 per cent, compared with a water abstraction reduction target of 20 per cent by 2020 (EEA 2019). Over half of abstracted water is used by agriculture, forestry and fishing, predominantly in southern Europe. Daily per capita water supply used has also declined by 16 per cent, largely due to improvements in conveyance systems (EEA 2018).
Despite reductions in water consumption, water scarcity has increased in the region, reducing available freshwater resources. This trend is particularly pronounced in southern countries, where more than half the population now lives in near permanent water scarcity. Rising climate-induced drought and flood frequencies are likely to further decrease freshwater resources in the future (EEA 2022). In response to water scarcity, efforts have focused on increasing supply and decreasing demand, typically via reservoir and dam construction, but also via saltwater desalination and the transference of water from other river basins. All these methods have ecological consequences – rerouting and damming rivers fragments their connectivity, while desalination is energy intensive and produces environmentally risky by-products (EEA 2022). Connected to the Atlantic Ocean, Pacific Ocean, the Mediterranean Sea and the Arctic Ocean, the European region is home to a wide range of diverse marine-related ecosystems, from warm waters to polar seas. Climate change impacts marine-related ecosystems, notably coastal fringes and low-lying areas through submergence. Flooding and erosion are increasingly relevant in the region due to more frequent storms, sea level rise, ocean acidification and eutrophication (UNEP 2017a). Further, the use of Europe’s seas is harming the condition of marine-related ecosystems, by changing the composition of marine species and their habitats as well as the overall physical and chemical characteristics of the sea (EEA 2021b). In the EU alone, the marine environment provides 6.1 million jobs and EUR 467 billion in gross value added (EC 2021a), despite rather low global shares of total marine catch, aquaculture production and inland catchments (FAO 2022b).
2.1.4.2 Data availability and indicator progress
Europe’s data availability for the 92 environment-related SDG indicators slightly improved since 2020. Fifty-five per cent of indicators lacked data or had insufficient data to analyse in 2022 compared with 63 per cent in 2020 (Figure 2.9); 28 per cent of indicators showed environmental improvement in 2022 compared with 26 per cent in 2020; and 16 per cent indicated environmental degradation in 2022 compared with 11 per cent in 2020 (Figure 2.11).
Figure 2.11 Environment-related SDG indicators data trend, Europe
● Positive trend ● Little change or a negative trend ● No data or insufficient data
Freshwater use has improved in efficiency (SDG indicator 6.4.1) and management implementation (SDG indicator 6.5.1) over the past five years, but water stress (SDG indicator 6.4.2) has also increased. Pre-2015 data on these indicators are limited. Freshwater quality and protection (SDG indicators 6.3.2 and 15.1.2b) has improved over the last two decades, with permanent freshwater area (SDG indicator 6.6.1) remaining stable. Marine quality and protection (SDG indicators 14.1.1a and 14.5.1) have slightly decreased and improved, respectively, over the last two decades. Fishery management (SDG indicators 14.6.1, 14.7.1 and 14.b.1) also improved in recent years, but data on these indicators remain limited. In addition, 56 per cent of marine-related SDG indicators lack data or have insufficient data to analyse.
Human water and sanitation services (SDG indicators 1.4.1, 3.9.2, 4.a.1, 6.1.1 and 6.a.1) are generally well recorded and have remained of high quality, with 60 per cent of indicators improving from 2000 to 2020. The mortality rate attributed to exposure to unsafe WASH services (SDG indicator 3.9.2) remains the lowest of the World Health Organization regions, but data limitations prevent analysis of this indicator’s current trends.
2.1.4.3 Water-related ecosystem conservation policies and accelerated action as part of the United Nations Water Action Decade and United Nations Decade of Ocean Science in Europe
Transboundary management of shared rivers, lakes and aquifers remains a potential source of political tension in the pan-European region, where only 20 countries have all shared waters covered by such arrangements. With water stressors, floods and drought periods likely to increase in the future, collaboration on shared resources remains a priority to avoid deterioration of political relationships and to ensure efficient management of river basins as whole entities (Baranyai 2019).
With both the Water Action Decade (2018–2028) and the Decade of Ocean Science (2021–2030) under way, water health and biodiversity remain in the spotlight for the international community. For the Decade of Ocean Science, 115 out of 294 Decade Actions have been announced in the European region, including projects dedicated to cleaning up pollution, improving data collection and filling knowledge gaps (UNESCO-IOC 2022). On the other hand, as a build-up to the United Nations 2023 Water Conference, which is a milestone for the Decade on Water Action, the second Dushanbe Water Action Decade Conference’s final declaration proclaimed 2025 the International Year of Glaciers’ Preservation and called for strengthening of transboundary cooperation, accelerated action in achieving the SDGs and the development of a Water Action Agenda mechanism to collate and accelerate all voluntary commitments at the 2023 Conference (Dushanbe Water Process 2022).
2.1.4.4 Remaining gaps
The wide range of climates, heterogeneous environments and the diverse national settings in the region consisting of 54 countries make it difficult to identify gaps that are over-grasping and relevant for all countries within the region (UNECE n.d.). Consequently, policies and procedures addressing the water realm need to be designed to deal with local conditions. While Europe is largely considered advanced in its water conservation efforts, water scarcity, drought, flooding and impacts from sea level rise are an increasingly widespread phenomenon in the region.
Several gaps related to water governance in Europe remain. While an integrative and multilevel water governance approach is in place, many countries in Europe still struggle to achieve good ecological status of their waters (Rowbottom et al. 2022). Additionally, involvement of local communities and stakeholders in water management in the region are often opaque and not transparent which results in a lack of buy-in and ownership of water management initiatives (Feldman 2022). As a result, fragmented responsibilities divided between different levels of government and various sectors lead to conflicting policies and a lack of coordination among relevant stakeholders (Wang, van Rijswick and Dai 2022). Lastly, there is still a need for greater investment in water infrastructure, including improvements to treatment facilities and distribution networks, to ensure that clean and reliable water is available to all Europeans to reduce inequalities in access (Surówka, Popławski and Fidlerová 2021).
Figure 2.10 Scorecard on the environmental dimension of the SDGs in Northern America
Click on the Goal to see related environmental indicators and their progress.
To go back, click again on the Goal (circle).
Hover on indicators to see their names
Note: The environmental dimension is not represented in Goal 10 and Goal 16
● Positive change
● Little change
● Negative change
● Some data
● No data
2.1.4.5 Freshwater and marine-related ecosystems in Northern America
2.1.4.6 Data availability and indicator progress
Of the 92 environment-related SDG indicators, Northern America’s data indicate that 25 per cent of indicators show environmental improvement in 2022 compared with 16 per cent in 2020 (Figure 2.8), and 16 per cent indicate environmental deterioration in 2022 compared with 23 per cent in 2020, while the rest of the SDG indicators lack data or have insufficient data to analyse (Figure 2.12).
Figure 2.12 Environment-related SDG indicators data trend, Northern America
● Positive trend ● Little change or a negative trend ● No data or insufficient data
Northern America’s freshwater-related ecosystems have increased in size and become more protected since 2000 as shown by the indicators tracked. The proportion of total land area that comprises permanent lakes and rivers has increased by 5 per cent (SDG indicator 6.6.1) (UNSD 2022b). Only 58 per cent of Northern American water bodies currently have good ambient water quality (SDG indicator 6.3.2) (UNSD 2022b). Despite this, freshwater-related ecosystems have become better protected, with the proportion of key freshwater biodiversity areas covered by protected areas increasing from 20 per cent in 2000 to almost 26 per cent in 2021 (SDG indicator 15.1.2a) (UNSD 2022b). The use of freshwater continues to be well regulated for public health, with 100 per cent of the population having basic sanitation services (SDG indicator 1.4.1), 97 per cent using safely managed drinking water services in 2020 (up from 95 per cent in 2005) (SDG indicator 6.1.1) and few deaths attributed to unsafe water (two deaths per 100,000) (SDG indicator 3.9.2) (UNSD 2022b). Although water-use efficiency has increased – by 8 per cent from 2015 to 2019 (SDG indicator 6.4.1) – water stress, a critical indicator that highlights the demand of a region exceeding the amount of water available, has stayed stagnant since 2015 at around 20 per cent (SDG indicator 6.4.2) (UNSD 2022b).
Northern America reported data for 7 of the 10 indicators that directly concern marine-related ecosystems. The proportion of key marine biodiversity areas covered by protected areas has seen a considerable increase (SDG indicator 14.5.1) from 28 per cent in 2000 to 34 per cent in 2021 (UNSD 2022b). Although protection varies between countries, Northern America has seemingly achieved the goal of 30 per cent of marine areas becoming marine protected areas and seen an increase in funds allocated to research in the field of marine technology. With only one data point, the proportion of fish stocks within biologically sustainable levels lies at 77 per cent (SDG indicator 14.4.1), although Canada reports that 94 per cent of their fish stocks are currently at sustainable levels (UNSD 2022b). Coastal eutrophication (SDG indicator 14.1.1a) has increased from 5.25 per cent in 2005 to 6.1 per cent in 2021 (UNSD 2022b), indicating a moderate increase in nutrient pollution. Although there has been some success in reducing eutrophication in some areas (e.g., Tampa Bay, Florida), two of the largest estuaries in Northern America, the Chesapeake Bay and the St. Lawrence River Estuary, continue to experience high nutrient loads (Boesch 2019). Finally, although there is only one data point for both indicators, the degree of implementation of the instruments to combat illegal and unregulated fishing is very high (5 out of 5) (SDG indicator 14.6.1) and the degree of implementation of the institutional, policy and legislative framework that countries provide to protect local fisheries and fishermen is also high (4 out of 5) (SDG indicator 14.b.1) (UNSD 2022b).
2.1.4.7 Water-related ecosystem conservation policies and accelerated action as part of the United Nations Water Action Decade and United Nations Decade of Ocean Science in Europe
For over 100 years, the United States of America and Canada developed environmental treaties and agreements together, as well as environmental partnerships at all levels of governments, to cover the 40 per cent of shared water border between the two countries. The first international treaty regarding the regulation of water quantity and quality was the Boundary Waters Treaty of 1909. It established the International Joint Commission, which has many advisory boards to aid in the regulation of old and new treaties in international water subtopic concerns. One such agreement is the Great Lakes Water Quality Agreement, which has led to palpable benefits in the health of the Great Lakes Ecosystem (Hartig, Krantzberg and Alsip 2020) and is signed by both countries. Its 2012 amendment focused on reducing 29 toxic pollutants alongside addressing invasive species, habitat and species loss, eutrophication and climate change impacts. In addition, all major rivers shared are regulated through large-scale acts such as the International Rivers Improvement Act which, alongside the North American Wetlands Conservation Act, regulates the construction, operation and management of river improvements and the subsequent ecosystems within them. These international environmental agreements have helped alleviate issues regarding water-related ecosystems and resources and have both prioritized water protections by internationally aiming to conserve 30 per cent of lands and waters within their countries by 2030.
At the federal level, the Canada Water Act 1970 provides the framework for cooperation between the country’s provinces and territories in the conservation, development and use of its water resources. Canada has also enforced the Canadian Environmental Protection Act 1999, which addresses pollution, protection of the environment and human health to contribute to sustainable development. The Fisheries Act, one of the oldest and most important federal laws for preventing water pollution, improves the protection of fisheries and their ecosystems by prohibiting the release of harmful substances to Canadian waters unless controlled by regulation. In June 2019, changes to the Fisheries Act were made to ensure stronger protections that aid in the sustainability of Canada’s fish and fish habitat. The Canadian Navigable Waters Act requires approval of any work that could intervene with any navigable Canadian waters. Canadian legislation also addresses water and ecosystem protection in territories shared with Indigenous people, through the Safe Drinking Water for First Nations Act (2013). It has since been repealed with a new piece of legislation aiming to be introduced in December 2022 through consultations with First Nations. The Arctic Water Pollution Prevention Act (1985) stipulates a “zero discharge” act and aids in marine protection and the maintenance of the traditional ways of life of the First Nations, known advocates for environmental preservation.
In the United States of America, the Clean Water Act (1972) aimed to restore and maintain the chemical, physical and biological integrity of waters and regulate the discharge of pollutants into the country’s waters. The National Environmental Policy Act 1970 requires federal agencies to assess the environmental effects of proposed actions prior to making decisions, which is instrumental in ensuring cohesive and substantial water and ecosystem protection. The Endangered Species Act, another cornerstone of environmental legislation, ensures protection for fish, wildlife and plants listed as threatened or endangered. Other crucial pieces of legislation focus on specific area protection, including the Coastal Zone Management Act, the Rivers and Harbors Appropriation Act, the National Marine Sanctuaries Act and the Coastal Wetlands Planning, Protection and Restoration Act. Such water and marinefocused acts do not negate the function of broader acts targeting climate change mitigation and resilience (of which ecosystem and water conservation are likely by-products) in both countries.
Northern America has heeded the calls to action for the Water Action Decade and Decade of Ocean Science. Canada and the United States of America have committed funds and resources directly to the Decades of Action. Both countries have established National Decade Committees and have set comprehensive goals for the Ocean Decade, which include leading several worldwide initiatives. For instance, in the United States of America, the National Oceanic and Atmospheric Administration (NOAA) works on science for the sustainable use of ocean resources for a healthy blue economy, food production and societal benefits. The NOAA Ocean and Coastal Council oversees participation in the Ocean Decade and is joined by more than 20 additional federal agencies through the Interagency Working Group on the Ocean Decade. In addition, the Environmental Protection Agency (EPA) of America has submitted the Ocean Dumping Management Program, which is awaiting endorsement as a Decade of Ocean Science programme. In Canada, in November 2018, the Minister of Fisheries, Oceans and the Canadian Coast Guard offered Canada’s support for the Ocean Decade, announcing an investment of up to US$ 9.5 million. Engagement in the Ocean Decade aligns with Canada’s plans to advance its blue economy strategy and commitments for a sustainable ocean economy.
2.1.4.8 Remaining gaps
Northern America has made a commendable effort to update several SDG indicators since the last Measuring Progress report (2021). SDG 14, which only had one indicator reported, has now expanded to include four indicators, providing several years of data, three of which are being reported for the first time. However, the use of heterogeneous tools, methodologies and sampling sites in both countries continues to disrupt official reporting.
Using internal data, Canada and the United States of America can still fill several gaps. For example, the National Coastal Condition Assessment of America (NCCA) (Environment Protection Agency [EPA] n.d.) monitors the ecological condition of estuarine and Great Lakes near shore waters, providing a source of data that could be used to guide management actions towards improved resilience and restoration of healthy and productive oceans (SDG target 14.2). The NCCA is involved in microplastics research projects and monitors nutrients and other contaminants resulting from landbased activities (SDG target 14.1) as well as research on ocean acidification field methods and can provide information about marine acidity (SDG target 14.3). Additionally, the National Aquatic Resource Surveys, which is the umbrella programme including the NCCA, have sampled data for freshwater ecosystems (lakes, reservoirs, rivers, streams and wetlands) which could be used to report on the status of freshwater body extent. The Water Quality Portal of America (WQP n.d.), which combines data from over 400 federal, state and local organizations, may be used to inform issues such as marine acidity. Similarly, Canada’s National Long-term Water Quality Monitoring Data portal measures multiple physical and chemical parameters of water quality at sampling sites throughout the nation.
2.1.5 Latin America and the Caribbean: Regional progress on the environmental dimension and state of the environment indicators of the SDGs
Figure 2.13 Scorecard on the environmental dimension of the SDGs in Latin America and the Caribbean
Click on the Goal to see related environmental indicators and their progress.
To go back, click again on the Goal (circle).
Hover on indicators to see their names
Note: The environmental dimension is not represented in Goal 10 and Goal 16
● Positive change
● Little change
● Negative change
● Some data
● No data
2.1.5.1 Freshwater- and marine-related ecosystems in Latin America and the Caribbean
Although the freshwater reserves of Latin America and the Caribbean (LAC) are unevenly distributed across the region’s 33 countries, they are the largest in the world. The ecosystems here play a key role in geochemical cycles, ecological processes and socioeconomic activities. For this reason, their rapid disappearance implies a high rate of loss in biodiversity and ecosystem services. Among the most affected natural environments are wetlands, where water quality and availability are impacted by a series of environmental stressors, including increasing urbanization, agricultural expansion and deforestation. Despite their relevance, wetlands in the region exhibit the most severe deterioration status (McInnes et al. 2020); the greatest reduction in the last 50 years has occurred in the LAC region, which has lost an estimated 59 per cent of wetland surface area (Alonso 2020).
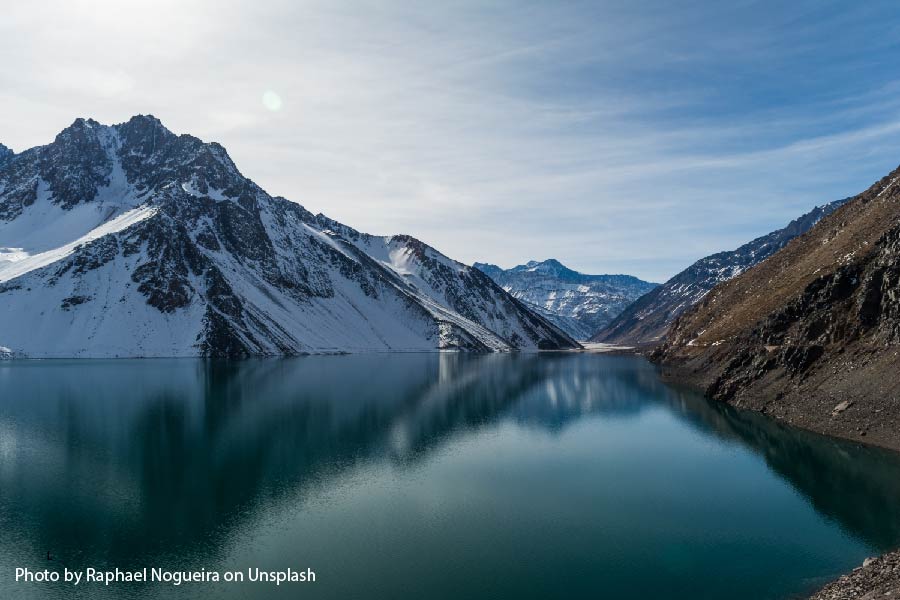
In addition, rising temperatures directly impact the tropical glaciers of the Andes, which provide more than 80 per cent of the water for the populations and ecosystems of the semi-arid tropical regions. Their accelerated melting generates uncertainty and concern about the long-term sustainability of water use and supply for these regions so vulnerable to climate change.
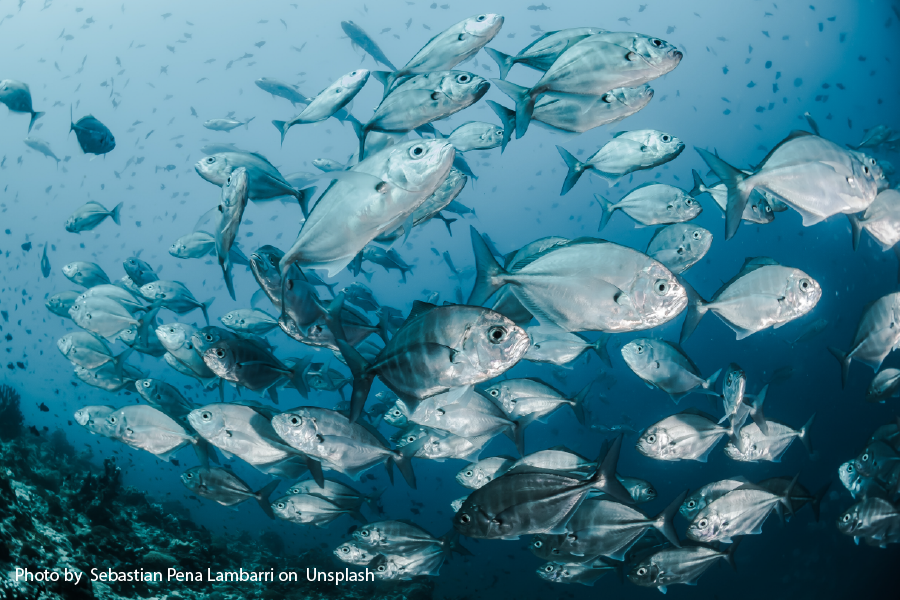
Pollution also threatens surface water habitats, which is home to 10 per cent of all known species and where 55 per cent of all fish rely on freshwater-related ecosystems for their survival. UNEP research shows that around one third of all rivers in Latin America (and Asia and Africa) suffer from severe pathogenic pollution (UNEP 2022a). Concentrations of fecal coliform bacteria, for instance, is estimated to affect around a quarter of Latin American river stretches, and there’s an increasing trend of concern since bacterial levels increased to a severe level or were at a severe level in 1990 and worsened in the following decades. Water streams are facing a critical threat of heavy metal pollution, associated with mining and its intensive water use.
- Twenty-seven per cent of the LAC population live in coastal areas; 23 of the region’s 33 countries have more marine than terrestrial territory.
- For 18 of these countries, the area of its exclusive economic zone exceeds 75 per cent of their total territory (UNEP 2016b; United Nations Economic Commission for Latin America and the Caribbean [UNECLAC] 2020).
- For 22 countries in the region, the sea represents 60 per cent or more of their sovereign territory (UNEP 2016b; UNECLAC 2020).
- The LAC region treasures the second largest barrier reef in the world, 47 of the 258 global marine ecoregions (UNECLAC 2020) and has 10 of the 66 large marine ecosystems of the world (LME 2022).
According to the Intergovernmental Panel on Climate Change, the ocean is projected to transition to unprecedented conditions over the twenty-first century due to several factors expected to increase the complexity of impacts and the vulnerability of the LAC’s socioeconomic and ecological systems. The increasing frequency of extreme events makes these threats particularly important for the small island developing countries of the Caribbean (UNECLAC 2020). The impacts of climate change on fishing areas range from the abnormal presence of sargassum in the Caribbean and negative effects on fisheries in the southeast Atlantic, to changes in the favourable conditions for fisheries affected by the Peru (Humboldt) Current, coral bleaching, more frequent flooding events and mangrove and coastal degradation.
2.1.5.2 Data availability and indicator progress
Measuring regional progress towards environment-related targets and SDGs in general presents several obstacles, two of which prove especially challenging in LAC: the heterogeneity of definitions and insufficiency (or absence) of information or reliable data sources. According to data from the SDG Indicators Database, the LAC’s region data availability has greatly improved since 2020, with a decrease in SDG indicators having no data or insufficient data from 60 per cent to 45 per cent in 2022 (Figure 2.13). The proportion of SDG indicators showing environmental improvement increased from 28 per cent in 2020 to 39 per cent in 2022, while the proportion of indicators showing environmental degradation increased from 12 per cent in 2020 to 16 per cent in 2022 (Figure 2.14).
Figure 2.14 Environment-related SDG indicators data trend, Latin America and the Caribbean
● Positive trend ● Little change or a negative trend ● No data or insufficient data
Three categories can be identified in relation to the freshwaterand marine-related SDG indicators. The first category includes freshwater-related ecosystems (SDG indicators 6.3.2, 6.4.2, 6.5.1, 6.5.2, 6.6.1 and 15.1.2) where all indicators possess enough data to analyse, and five out of the six indicators showing environmental improvement in 2022 compared with 2020. The second category includes SDG indicators identified as human uses and activities (SDG indicators 1.4.1, 3.9.2, 4.a.1, 6.1.1, 6.2.1, 6.3.1, 6.4.1 and 6.a.1) in the LAC region. Their improvement can be evaluated for basic health and infrastructure services: the South America subregion exhibits the highest values, followed by Central America and the Caribbean. Insufficient financing seems to be the main constraint, observed especially in the slow progress of flattened curves observed for those indicators related to costly infrastructure, such as wastewater treatment or water-use efficiency.
On the other hand, the situation is different for the third category that covers marine and coastal ecosystems (SDG indicators 14.1.1a, 14.5.1, 14.6.1, 14.7.1, 14.a.1 and 14.b.1), where indicators possessing enough data to analyse increased from 11 per cent in 2020 to 44 per cent in 2022. Yet, equal proportions (22 per cent) are recorded for the remaining indicators, indicating mixed environmental situation for the region.
2.1.5.3 Water-related ecosystem conservation policies and accelerated action as part of the Water Action Decade and Decade of Ocean Science for Sustainable Development
Many conservation initiatives and policies were adopted and implemented in LAC countries. For instance, initiatives related to the development of monitoring and information systems were implemented in Antigua and Barbuda, Argentina, Brazil, Costa Rica, Mexico, Panama and Peru. National plans and strategies for the implementation of integrated water resources management and regulations on water quality standards were adopted in Antigua and Barbuda, Barbados, Belize, Brazil, Chile, Colombia, Costa Rica, Dominican Republic, El Salvador, Mexico, Paraguay and Peru.
Three LAC countries committed to actively participate in the Water Action Decade. Next to outlining national water policies, Brazil, El Salvador and Paraguay used their country statements to stress the importance of regional cooperation, their determination to improve access to sanitation and the relevance of water management for disaster risk reduction (UN-Water n.d.). In addition, UNECLAC led three region-wide initiatives to accelerate the achievement of SDG 6 on a regional level: (a) the Annual Water Dialogues 2022, used as a platform to collect inputs from UNECLAC member States for the midterm review of the Water Action Decade in 2023; (b) the consolidation of a regional water expert group including 20 institutions combining efforts to promote the achievement of SDG 6 and (c) online consultations of stakeholders from 24 LAC countries aiming to identify major regional topics for the United Nations 2023 Water Conference. Results show that strengthening water governance, ensuring access and affordability of water and sanitation and preserving water-related ecosystems through nature-based solutions rank highest on the regional water agenda (UNECLAC 2022).
2.1.5.4 Remaining gaps
Freshwater-related ecosystems and the water-associated economic sectors likely show more management challenges and governance gaps than any other natural resource, as water is a key environmental component but also a human right and economic asset. Progress in implementing effective integrated water policies varies in and between LAC countries. The institutional and territorial fragmentation of stakeholders and competences, in addition to the mismatch between administrative units and hydrological basins, generates policy gaps, which are followed by accountability and funding gaps (OECD 2012).
The intrinsic multilevel, uncoordinated governance of water resources often results in silo-approaches, which in turn explain the information and capacity gaps observed in most LAC countries (OECD 2012). This cause-effect succession frequently ends up closing a circle, where the lack of information undermines communities (at all levels) in coordinating efforts to effectively manage water resources and design integrated and coherent water policies. All these factors are exacerbated by the forecasts suggesting an increase in urbanization, which is both an opportunity for sustainable development and an economic, social and environmental challenge, since its accelerated rhythm raises complex territorial effects (OECD 2022). The scenario of a rapid, unplanned urban growth, along with the context of periodic fluctuations in economy, and the contribution of water-dependent activities (e.g. agriculture and mining) in regional GDP, explains why territorial planning and budgetary weaknesses are reflected so clearly in the scarcity of information related to water- and freshwater-related ecosystems monitoring.
The large area of national marine territories and severe budgetary constraints to carry out research, monitoring and patrolling activities are a fraction of the challenges faced in the region. Increased cross-sectoral cooperation, both within and between countries, will be needed to develop robust, reliable and sustained monitoring databases for marine data and information (UNECLAC 2020). In addition, the nature of oceanic processes requires a set of systematic, comparable international indicators capable of monitoring pressures, identifying trends in the state of marinerelated ecosystems and assessing the effectiveness of policies and resource-use practices.
2.1.6 Northern Africa and Western Asia: Regional progress on the environmental dimension and state of the environment indicators of the SDGs
Figure 2.15 Scorecard on the environmental dimension of the SDGs in Northern Africa
Click on the Goal to see related environmental indicators and their progress.
To go back, click again on the Goal (circle).
Hover on indicators to see their names
Note: The environmental dimension is not represented in Goal 10 and Goal 16
● Positive change
● Little change
● Negative change
● Some data
● No data
Figure 2.16 Scorecard on the environmental dimension of the SDGs in Western Asia
Click on the Goal to see related environmental indicators and their progress.
To go back, click again on the Goal (circle).
Hover on indicators to see their names
Note: The environmental dimension is not represented in Goal 10 and Goal 16
● Positive change
● Little change
● Negative change
● Some data
● No data
2.1.6.1 Freshwater- and marine-related ecosystems in Northern Africa and Western Asia
Water resources availability and type vary across the region; some countries have abundant surface water and groundwater resources and ecosystems, while others are mostly covered by deserts and depend on groundwater abstraction (UN 2022a), water desalination (Maftouh et al. 2022) and wastewater reuse for agriculture (Aydin, Aydin, Beduk and Bahadir 2016) to meet the increasing water demand. In 2019, the top three countries in the world with the most severe level of water stress were located in the region: United Arab Emirates (UAE), Algeria and Bahrain (UNSD 2022b). The summer of 2022 was hotter than almost any previous summer across Western Asian countries, with temperatures rising to nearly 50° Celsius — almost 7° Celsius higher than the usual for that time of year. Even with arid and semi-arid climates in the region, many countries have witnessed flooding and droughts in recent years (Loudyi and Kantoush 2020).
The region comprising Northern Africa and Western Asia contains a wide contrasting range of marine and costal ecosystems including springs, estuaries, mudflats, marshes, mangroves, seagrass beds and coral reefs (UNEP n.d.b). Such a diversity of ecosystems supports considerable biodiversity that is particularly vulnerable to any outside stressors such as water temperature fluctuations and changes, pollution, increased ocean acidity and changes in water flow (UNEP 2017b). Due to its unique climate conditions, the Western Asia and Northern Africa region is likely to be one of the hardest hit by climate change impacts through intensification in scope and severity of droughts and desertification (UNEP n.d.b). Some of these effects include the loss of coastal zones due to sea level rise, seawater temperature rise, increased water scarcity and increased groundwater salinity, which are the most significant for biodiversity and will have severe impacts on almost all aspects of life in the region.
2.1.6.2 Data availability and indicator progress
Out of the 92 environment-related SDG indicators, a minor change has been recorded between data availability and unavailability compared with 2020. SDG indicators that do not possess data or sufficient data to analyse decreased from 57 per cent in 2020 to 55 per cent in 2022 for Western Asia (Figure 2.16), while a decrease from 59 per cent in 2020 to 55 per cent in 2022 was recorded for Northern Africa (Figure 2.15). The proportion of SDG indicators showing environmental improvement has increased by 2 per cent to 28 per cent in 2022 for Northern Africa, while it remained constant at 32 per cent for Western Asia. A 1 per cent increase was recorded for both subregions in 2022 for SDG indicators showing environmental degradation (Figure 2.17).
Figure 2.17 Environment-related SDG indicators data trend, Northern Africa
● Positive trend ● Little change or a negative trend ● No data or insufficient data
Figure 2.17 Environment-related SDG indicators data trend, Western Asia
● Positive trend ● Little change or a negative trend ● No data or insufficient data
Data availability of SDG indicators related to freshwater and marine ecosystems improved between 2020 and 2022. Freshwater-related SDG indicators showing environmental improvement increased from 31 per cent in 2020 to 54 per cent in 2022 in Northern Africa, while Western Asia witnessed an increase from 38 per cent in 2020 to 46 per cent in 2022. Similarly, 22 per cent of marine-related SDG indicators showed environmental improvement for Northern Africa and Western Asia in 2022, an increase from 11 per cent in 2020 for both subregions.
2.1.6.3 Water-related ecosystem conservation policies and accelerated action as part of the Water Action Decade and Decade of Ocean Science Sustainable Development
Many water conservation policies are being adopted in the region, with some countries aiming to increase their water-use efficiencies. For instance, Saudi Arabia’s Ministry of Environment, Water and Agriculture launched a programme aiming to reduce daily per capita consumption from 263 litres (2019) to 150 litres by 2030. The water conservation programme will be implemented by the Government-owned National Water Company in all regions of the country. The State of Qatar, through its National Vision, aims to balance economic development with human and natural resources by rationalizing water consumption and encouraging the use of non-conventional water resources. On the other hand, preserving marine-related ecosystems is of priority as well. For instance, providing a sustainable environment and infrastructure is one of the six pillars of the UAE National Agenda, which has introduced various marine conservation programmes, including mangrove tree planting and coral restoration, and is working continuously on increasing the size of marine protected areas. By launching the Mangrove Rehabilitation Project in 2020, the UAE has been planting mangrove seed balls via specialized engineered drone rigging and then monitoring them monthly for growth over a year.
As part of the Water Action Decade, the countries of the region have pledged to prioritize water for sustainable development, demonstrated by the recommendations and positions adopted in intergovernmental and regional forums, including by the Arab Ministerial Water Council, the Economic and Social Commission for Western Asia (ESCWA) Committee on Water Resources and in regional water consultations. Also, in 2018, countries agreed to strengthen integrated water resources management, enhance cooperation on shared water resources, attend to climate change adaptation and natural disaster risk reduction and provide access to water services for all (Economic and Social Commission for Western Asia [ESCWA] 2019). Moreover, in 2019 the Arab Ministerial Water Council reviewed its adopted Arab Strategy for Water Security, which focuses on the regional priorities for improved water security (ESCWA 2019).
A couple of initiatives were planned as part of the Ocean Decade, including the West Asia Blue Waters, which attempts to link science and life to improve ocean literacy among the population in the region, as well as the initiative to improve the hydrographic and oceanographic observations to support marine research in Moroccan marine zones (UNESCO-IOC 2022a).
2.1.6.4 Remaining gaps
Nine out of the 17 most water-stressed countries in the world are in Northern Africa and Western Asia (in alphabetical order): Bahrain, Jordan, Kuwait, Lebanon, Libya, Oman, Qatar, Saudi Arabia and UAE (Hofste, Reig and Schleifer 2019).[ 4 ] Migration from rural to urban areas, a fast-growing population, poor water management, deteriorating infrastructure and water governance issues are directly affecting the water realm, and these severe impacts are disproportionately borne by the most vulnerable sectors of society (UNEP n.d.c). These factors, among others, have triggered conflicts and rivalries in the region with severe impacts on people and the environment. In this context, environmental governance, science, technology and finance for the water sector play a pivotal role in achieving prosperity and resilience by providing a platform for recovery, development and security (UNEP n.d.d). Cross-sectoral collaboration and partnership need strengthening to facilitate a more holistic decision-making approach for the conservation of water resources by the governments, private sectors and civil societies (UNEP n.d.b).