General Indicators
Indicator 1a : Ecological deficit per capita (Biocapacity) - Period 1961 - 2018
Definition:
1. Ecological deficit / reserve: the difference between the Biocapacity and Ecological Footprint of a region or country.
2. Biocapacity: ecosystems' capacity to produce biological materials used by people and to absorb waste material generated by humans, under current management schemes and extraction technologies.
Analytical part :
• The Mediterranean’s Biocapacity Deficit (-2.28 gha/cap) is almost two times higher than the world’s Biocapacity Deficit (-1.2 gha/cap).
• From 2010 to 2008, the Mediterranean’s Biocapacity Deficit per capita increased in most Mediterranean countries and reached 2.7 gha/cap. From 2009 to 2013 the Ecological Footprint per capita decreased to reach 2.15 gha/cap (same as 1995). Since 2014, Ecological Footprint per capita has increased again.
• The Mediterranean’s Biocapacity Deficit of the northern Mediterranean countries started to decrease in the last few years. This is mostly due to the effects of the economic crisis, which slowed down resource consumption and, primarily, CO2 emissions.
The Ecological Footprint is used to assess the level of the consumption of available resources connected to human activities. Compared to the Biocapacity, this indicator offers the possibility to calculate the Ecological Deficit or Reserve in a region or country.
Source: Global Footprint Network, National Footprint and Biocapacity Accounts, 2022 Edition.
General Indicators
Indicator 1b: Ecological footprint of the economy in 2017
Definition: Ecological Footprint: a measure of how much area of biologically productive land and water an individual, population, or activity requires to produce all the resources it consumes and to absorb the waste it generates, using prevailing technology and resource management practices.
In 2018, the Mediterranean’s Ecological Footprint (3.4 gha/cap) is higher than the planet’s Ecological Footprint (2.8 gha/cap).
The Ecological Footprint per unit of GDP is less than 230 gha per million dollars for half of the northern countries. However Bosnia and Herzegovina and Montenegro peak respectively at 633 gha and 526 gha. In the southern countries the maximum values are for Egypt (639 gha per million of dollars) and Morocco (529).
Precautions / Notes: (1b)“Ecological Footprint” only measures one aspect of sustainability, which is whether human societies are able to live within their annual biocapacity budget. It therefore deals with only the environmental pillar of sustainability and, even for this pillar, important environmental parameters are not considered (pollution due to GHGs other than CO2 , impact of nuclear energy, etc.).
Source: Global Footprint Network, National Footprint and Biocapacity Accounts, 2022 Edition.
General Indicators
Indicator 2: Human Development Index - 2021
The Human Development Index (HDI) is a composite index, developed by UNDP, that measures the evolution of a country according to three basic criteria:
• Health and longevity, measured by life expectancy at birth.
• Knowledge and education, measured by the mean years of schooling and the expected years of schooling.
• Standard of living, indicated by the GNI per Capita (PPP not constant US dollars).
The HDI is standardized and used to classify countries by values between 0 and 1.
The human development index (HDI) with its three components (health, education and income) enables us to identify and understand the social component of sustainable development.
The average HDI in 2021 was 0.773 points for the Mediterranean region, less than the last update in 2018 with 0.794.
With an average HDI of 0.773 in 2021, the Mediterranean region was above the world value of 0.723 (based on 184 countries).
However, there are great differences between countries:
• 11 countries have high HDI, greater than 0.8: Israel (ranked 22nd out of 184 worldwide), Malta, Slovenia, Spain, France, Cyprus, Italy, Greece, Croatia, Türkiye, Montenegro (49th worldwide).
• 9 countries (7 in 2018) have HDI between 0.7 and 0.8: Albania, Bosnia and Herzegovina, Algeria, Tunisia, Libya, State of Palestine and Lebanon (110th worldwide).
• 4 countries have HDI lower than 0.7: Morocco and The Syrian Arab Republic with 0.57 (144th worldwide).
The years of schooling have constantly increased since 2010. It slightly decreased in 2021 in some Mediterranean countries.
The difference is 11 years between The Syrian Arab Republic (9.1) and Greece (20).
The Mediterranean average (14.4 years ) of years of schooling remains above the global average (8.7 years).
Analytical part :
Indicator 2a: Expected years of schooling
The years of schooling have constantly increased since 2010. It slightly decreased in 2021 in some Mediterranean countries.
The difference is 11 years between The Syrian Arab Republic (9.1) and Greece (20).
The Mediterranean average (14.4 years ) of years of schooling remains above the global average (8.7 years).
Precautions / Notes: An HDI value greater than 0.8 is generally considered high. A value below 0.55 is considered low. The calculation methodology was changed in 2013 and had the effect of decreasing the HDI values (with a small impact on country rankings).
Source: United Nations Development Programme Database and report, 2021.
General Indicators
Human Development Index - 2021
Indicator 2b : Life expectancy at birth
Definition : The Human Development Index (HDI) is a composite index, developed by UNDP, that measures the evolution of a country according to three basic criteria:
• Health and longevity, measured by life expectancy at birth.
• Knowledge and education, measured by the mean years of schooling and the expected years of schooling.
• Standard of living, indicated by the GNI per Capita (PPP not constant US dollars).
The HDI is standardized and used to classify countries by values between 0 and 1.
The life expectancy at birth, which accounts for one third of the HDI, shows a gap of 13.6 years between Egypt (70.2) and Malte (83.8).
Precautions / Notes: An HDI value greater than 0.8 is generally considered high. A value below 0.55 is considered low. The calculation methodology was changed in 2013 and had the effect of decreasing the HDI values (with a small impact on country rankings).
Source: United Nations Development Programme Database and report, 2021.
General Indicators :
Indicator 3 : Annual growth rate of real GDP per capita (SDG Indicator 8.1.1)
Definition: SDG Indicator 8.1.1: Annual growth rate of real GDP per capita
• The Gross Domestic Product (GDP) is the value of all the goods and services produced in a country in a year. The GDP can be calculated by adding up all the items of income – salaries, interests, profits and rents – or by calculating the expenditure – consumption, investment, public purchases, net exports, (exports less imports) – of an economy.
• Annual growth rate of real Gross Domestic Product (GDP) per capita is calculated as the percentage change in the real GDP per capita between two consecutive years. Real GDP per capita is calculated by dividing GDP at constant prices by the population of a country or area.
The data for real GDP is measured in constant US dollars to facilitate the calculation of regional and global aggregates.
Analytical part : Although insufficient to measure the development level of a country, the GDP per capita remains an unavoidable indicator for comparing economic situations in terms of income.
The GDP growth rates in the south and east Mediterranean countries are higher than those of the EU Mediterranean countries. However, they are considered low when compared to the population growth rates, as the demographic growth is still high in the southern Mediterranean countries.
In 2021, the average income per capita in the South and East Mediterranean countries (10 000$) is more than 4 times lower than the average income in the EU Mediterranean countries (40 000$).
The share of the Mediterranean GDP in the world GDP is decreasing: from 14.1% in 2000 to 12.6% in 2010, 11.3% in 2018 and 8% in 2021.
This value is to consider with attention because the GDP per inhabitant has increased since 2018 for all of the Mediterranean countries (except for Lebanon, Libya and The Syrian Arab Republic) but less than the other countries in the world.
Meanwhile, the share of the Mediterranean population remains constant in the world population (about 7%).
Precautions / Notes:
- By using PPP rather than the exchange rate, the GDP per capita of a country, calculated in units of national currency, can be converted into GDP per capita in dollars, while taking into account the differences in domestic prices for the items being considered (PPP gives the value of a typical basket of goods in different countries)
- Figures are based on constant 2010 USD for the period 2010-2015 and constant 2015 USD for the period 2015-2021.
Source: World Bank national accounts data and Organisation for Economic Cooperation and Development National Accounts data files, 2021.
General Indicators
Indicator 4 : Youth literacy rate
Definition: Literacy rate between ages 15 to 24 is presented as a percentage of the total population of this age group. People are considered literate when they can read, write, and understand a short simple article concerning their daily life (Millennium Indicator n°8). This indicator is linked to the SDG Indicator 4.6.1: Proportion of population in a given age group achieving at least a fixed level of proficiency in functional (a) literacy and (b) numeracy skills, by sex
Analytical part : Access to primary education is a key issue for the UNESCO « Education for All » programme as well as for the Sustainable Development Goal 6*.
The literacy rate of young adults reflects the primary education received in the previous decade.
This objective has been taken up in the MSSD for all the young adults, by stressing its importance in rural areas and for girls in order to reduce the disparities yet significant in the Mediterranean.
Since 1990, the literacy rate of young adults has increased significantly in all of the southern and eastern Mediterranean countries and is satisfactory in most of the northern Mediterranean countries.
The ratio of the literacy rate of girls compared to boys less than 1 indicates a lack of education for girls. The rate is less than 0.99 in Egypt and The Syrian Arab Republic.
Precautions / Notes: Measurement of literacy can vary from a simple question “Can you read and write?” to various evaluation tests to assess the levels of literacy. In some cases, literacy is roughly measured in censuses with self-report or by estimating the population not attending school or uneducated.
The definitions of literacy used in the national surveys often differ from that of UNESCO. The types of survey carried out in different countries to estimate the literacy rate are also different from one another and from year to year. The data resulting from these surveys should, therefore, be considered with caution.
*This indicator is no longer a priority criteria put forward by UNESCO. Only 9 Mediterranean countries are covered by this indicator in 2021, whereas in 2019 the data existed for 20 countries.
Source: United Nations Educational, Scientific and Cultural Organization Institute for Statistics, 2021.
General Indicators
Indicator 5 : Girl/Boy primary, secondary and tertiary school registration ratio
Definition : This indicator is the parity index between girls and boys for the gross enrolment rate (primary, secondary and combined) defined by UNESCO. It refers to the number of girls enrolled in primary and secondary schools, in public and private schools compared to the number of boys.
The gross enrolment rate is the ratio of the number of students enrolled in schools at different grade levels (such as elementary, middle school and high school), regardless their age, and is expressed as a percentage of the population in the official age group corresponding to this level of education.
Analytical part : Education and gender equality are central concerns in the new sustainable development agenda. The Education 2030 Framework for Action, agreed by the global education community in November 2015 to accompany the SDG agenda, recognizes that gender equality is inextricably linked to the right to education for all, and that achieving gender equality requires an approach that « ensures that girls and boys, women and men not only gain access to and complete education cycles, but are empowered equally in and through education».
In 2018, the enrolment rate in primary education is over 99% in most Mediterranean countries except in The State of Palestine (98.6%), Türkiye (94.9%) and Croatia (94.6%).
In secondary education the gross enrolment rate is over 95% in 11 countries.
In 2020 the terminology changed : from “primary, secondary, tertiary” to early “childhood, pre-primary, tertiary”. The analysis is not possible.
Précaution /notes :This indicator is not an accurate measurement of school access for girls because the improvements of the report may reflect an increase enrolment of girls receiving education or a decrease in the case of boys. The gross enrolment rate could be over 100% because of late admission and/or because of repletions
Source: United Nations Educational, Scientific and Cultural Organization Institute for Statistics, 2020. United Nations Educational, Scientific and Cultural Organization, Global education monitoring report summary, 2020: Inclusion and education: all means all.
Sea And Coasts
Indicator 6 : Number of ratifications and level of compliance as reported by Barcelona Convention Contracting Parties
Definition: The signature qualifies the signatory state to proceed to ratification, acceptance or approval. It also creates an obligation to refrain, in good faith, from acts that would defeat the object and the purpose of the convention.
Ratification defines the international act whereby a state indicates its consent to be bound to a convention if the parties intended to show their consent by such an act. Entry into force of an international convention takes place when it becomes legally binding on the parties. The parties have to decide to apply for the convention.
Analytical part : The Convention for the Protection of the Mediterranean Sea Against Pollution was adopted on 16 February 1976 and entered into force on 12 February 1978. The original Convention has been modified by amendments and the “Convention for the Protection of the Marine Environment and the Coastal Region of the Mediterranean” was adopted on 10 June 1995 and entered into force on 9 July 2004.
In 2023 (compare to 2019):
- 1 Contracting Party (Malta) has signed and entered into force the ICZM protocol (in 2019)
- 1 Contracting Party (B & H) has signed and entered into force the Barcelona Convention (in 2020)
Precautions / Notes: This indicator is very complex and provides only an overview of the status. All details can be found in the official documents of the Convention. A country can implement a protocol without signature and it can take more protective measures.
Source: United Nations Environment Programme/Mediterranean Action Plan, 2023. http://www.unenvironment.org/unepmap/who-we-are/contracting-parties
Sea And Coasts
Indicator 7 : Coverage of protected areas in relation to marine territorial waters (SDGs indicator 14.5.1)
Definition: Indicator 14.5.1: Coverage of protected areas in relation to marine areas shows temporal trends in the mean percentage of each important site for marine biodiversity (i.e., those that contribute significantly to the global persistence of biodiversity) that is covered by designated protected areas.
In the Mediterranean, “Marine Protected Area” (MPA) is understood as any marine and/or coastal area (including lagoons that are permanently linked to the sea) that has been put under protection generally by legal means for the conservation of natural habitats, species or specific natural features as its prime purpose. It thus includes a wide range of areas, established under various designations, at various levels (subnational, national, regional or even international), and providing various degrees of protection. “Other Effective area-based Conservation Measures” (OECMs), originates from the Convention on Biological Diversity to also indicate protection designations, although there is no clear international guidance as to how the term applies.
Analytical part : The 1,233 MPAs and OECMs cover 9% (226,665 km²) of the Mediterranean (2,516,900 km2) through a large variety of conservation designations. Over 70% of the surface covered is located in the Western Mediterranean. Designations cover more than 10% of European waters due to national MPAs and to the Natura 2000 at sea network which rarely affords strict restrictive measures.
The declaration of the Spanish Cetacean Corridor MPA, on 30 June 2018, has revitalized the process of protecting Mediterranean marine areas. One of the main objectives of this MPA of 42,262.82 km² along the east coast of Spain is to avoid, mitigate and reduce anthropogenic underwater noise. The enlargement of the Cabrera National Park (43,070.55 km², also in Spain), officially recognized in January 2019, extends the dynamic of protecting the Mediterranean.
Now to reach the quantitative Aichi Target of 10% coverage, an additional 25,025 km2 (1 % of the Mediterranean) would need to be placed under strong protection designations.
Beyond the coverage figures, clear action plans must accompany the establishment of MPAs and OECMs in order to improve their management effectiveness.
Precautions / Notes: The indicator is used to track progress towards the 2011–2020 Strategic Plan for Biodiversity and was used as an indicator towards the Convention on Biological Diversity’s 2010. Some discrepancies could be due to the numerous types of protected areas and their overlapping.
Sources: MAPAMED, the database on Sites of interest for the conservation of marine environment in the Mediterranean Sea. MedPAN, UNEP/MAP/SPA-RAC. 2019 release. United Nations Environment Programme/Mediterranean Action Plan and Plan Bleu (2020), State of the Environment and Development in the Mediterranean, Nairobi.
Sea And Coasts
Indicator 8 : Proportion of fish stocks within biologically sustainable levels (SDG Indicator 14.4.1)
Definition: Indicator 14.4.1: Proportion of fish stocks within biological sustainable levels (not overexploited). This indicator measures the sustainability of the world’s marine capture fisheries by their abundance. It is classified Tier I (conceptually clear, internationally established methodology and standards are available, and data are regularly produced by countries). A fish stock of which abundance is at or greater than the level that can produce the maximum sustainable yield is classified as biologically sustainable. The maximum sustainable yield (MSY), is the highest theoretical equilibrium yield that can be continuously taken (on average) from a stock under existing (average) environmental conditions without significantly affecting the reproduction process.
Most stocks for which validated assessments are available continue to be fished beyond biologically sustainable limits. Nevertheless, in the Mediterranean (and Black Sea), recent trends continue to show a consistent decrease of overexploited stocks, especially since 2014:
- The overexploitation of stocks has decreased over the past decade, with an accelerated reduction of fishing pressure in the last two years, particularly for key species under management plans. However, most commercial species are still overexploited, and fishing pressure is still double what is considered sustainable.
- Status of Mediterranean and Black Sea commercial marine living resources and vulnerable species groups: most commercial stocks (73 %) are fished outside biologically sustainable limits, and fishing pressure is still twice the level considered sustainable (F/FMSY = 2.25). However, fishing pressure in the Mediterranean and the Black Sea has decreased on average by 21% over the last decade and, for certain priority species subject to management measures, by as much as 75%.
- Although it continues to improve, scientific advice on the status of resources in relation to biomass is scarcer than advice with respect to fishing mortality.
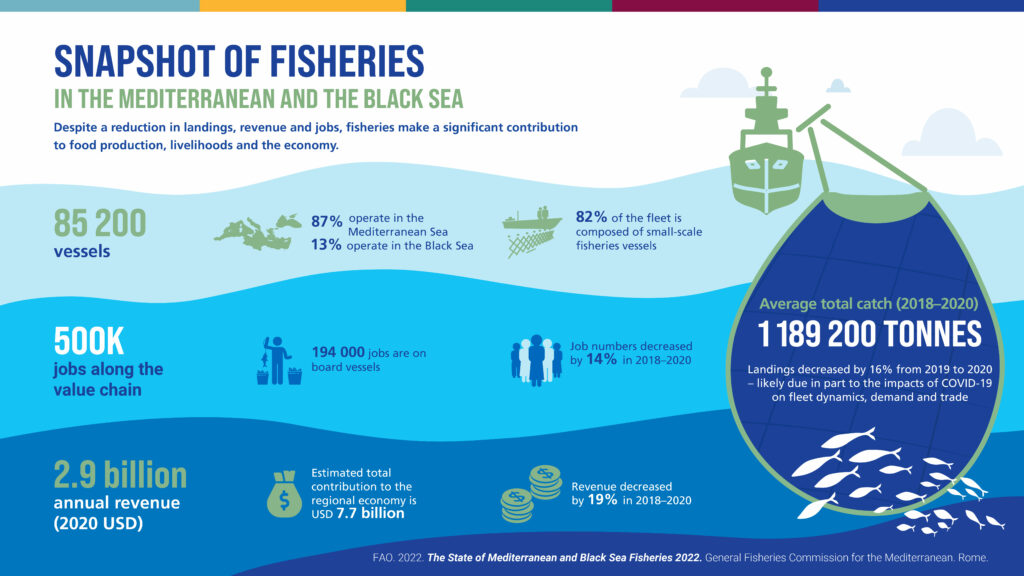
In the Mediterranean, the total capture decreased from 801,000t to 746,000t between 2019 and 2020.
Among the 10 major fishing countries in the Mediterranean Sea (annual catch > 20,000 tonnes), Türkiye has seen the largest increase in tons* (+42 %) in 1 year (2019-2020), while Italy has seen the largest decrease (-26 %). Half of the Mediterranean countries caught* less than 5,000t in 2020, while Italy captured 130,000t, Tunisie 103,000t and Algeria 81,000t (-19.000t in 1 year).
Precautions / Notes: The number of GFCM’s assessments validated differs a lot depending on years and Geographical Subareas (GSA) (e. g.: 27 in 2007 and 53 in 2018 for the entire Mediterranean). This could lead to misleading exploitation ratio means. “Priority species” are important species in terms of landings and/or economic value at the regional and subregional levels. On the map, the “Other” category represents all fish species whose catches from 1970 to 2018 represent less than 500,000 tonnes in total.
Fisheries catches are considered as the total live weight caught during fishing, whereas landings represent the weight landed as recorded at the time of landing. The difference between both can be explained by discarded catch, losses in handling or other reasons.
Sea And Coasts
Indicator 8b
Definition: Indicator 14.4.1: Proportion of fish stocks within biological sustainable levels (not overexploited). This indicator measures the sustainability of the world’s marine capture fisheries by their abundance. It is classified Tier I (conceptually clear, internationally established methodology and standards are available, and data are regularly produced by countries). A fish stock of which abundance is at or greater than the level that can produce the maximum sustainable yield is classified as biologically sustainable. The maximum sustainable yield (MSY), is the highest theoretical equilibrium yield that can be continuously taken (on average) from a stock under existing (average) environmental conditions without significantly affecting the reproduction process.
Precautions / Notes: The number of GFCM’s assessments validated differs a lot depending on years and Geographical Subareas (GSA) (e. g.: 27 in 2007 and 53 in 2018 for the entire Mediterranean). This could lead to misleading exploitation ratio means. “Priority species” are important species in terms of landings and/or economic value at the regional and subregional levels. On the map, the “Other” category represents all fish species whose catches from 1970 to 2018 represent less than 500,000 tonnes in total.
Fisheries catches are considered as the total live weight caught during fishing, whereas landings represent the weight landed as recorded at the time of landing. The difference between both can be explained by discarded catch, losses in handling or other reasons.
Sources: United Nations Food and Agricultural Organization/General Fisheries Commission for the Mediterranean, Capture production database, 2022; FAO/GFCM, The State of the Mediterranean and Black Sea Fisheries 2020, 2022.
Contact Us: alafitte@planbleu.org